Week 7 State of charge estimation
Aim:-
1.Simulate the 3 test cases from harness dashboard and write a detailed report on the results
2.What is coulomb counting? Refer to the above model and explain how BMS implements coulomb counting for SOC estimation ?
Task 1
Simulate the 3 test cases from the harness dashboard of the BMS project model and write a detailed report on the results
Lithium-ion battery packs are widely used energy storage systems in electric vehicles. The battery management system (BMS) is responsible for safe operation, performance, and battery life under diverse charge-discharge and environmental conditions. When designing a BMS the cell voltage and temperature, state of charge, state of health and the charging profile has to be controlled and maintained.
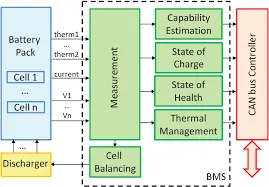
Also, it indicates whether there has been a fault, for example, that any cell has reached an over-temperature condition or under-voltage condition (Under-voltage occurs when the average voltage of a system drops below intended levels. It is usually caused by undersized or overloaded utility).
This article will help you to get an insight into the BMS model and it also discusses the various subsystems used here. We will also see how the faults parameters can be indicated with the help of the BMS closed loop using SIMULINK.
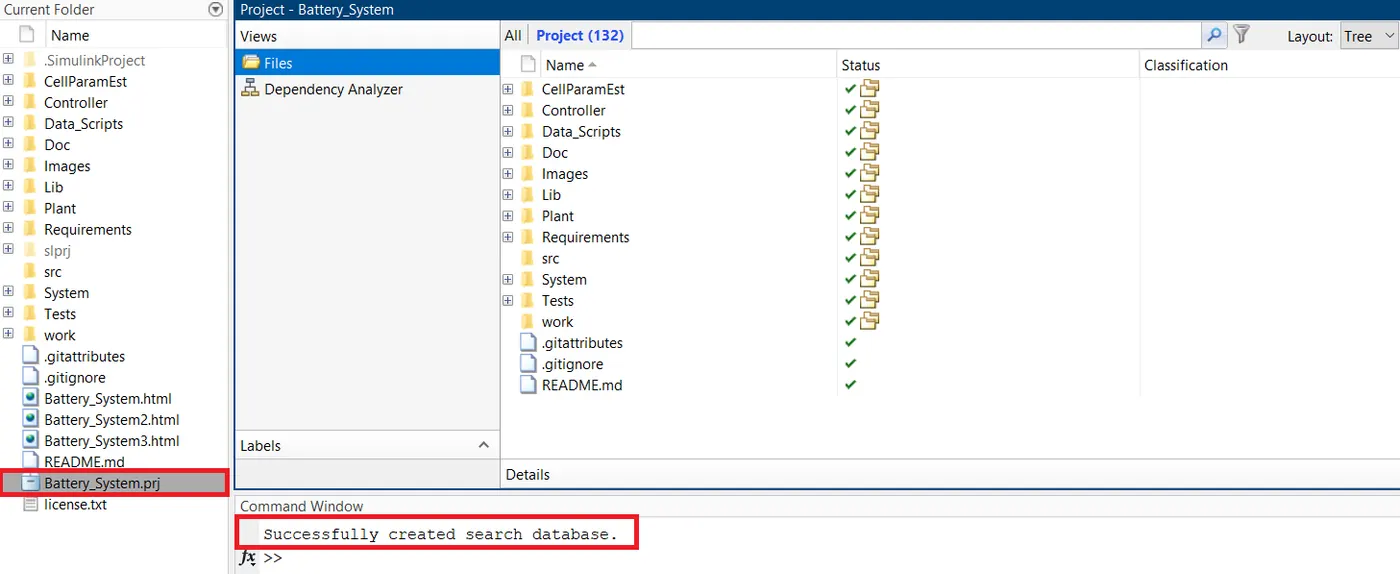
- The above image shows there are certain errors. To remove these errors, we have to open the model from the correct source. For this, click on Battery_System.prj and make sure that all the files have a green tick indicating that the BMS model is ready to start without any interruptions. The command line shows the message “Successfully created search database” which means that the system has no errors.
The following documentation opens up.
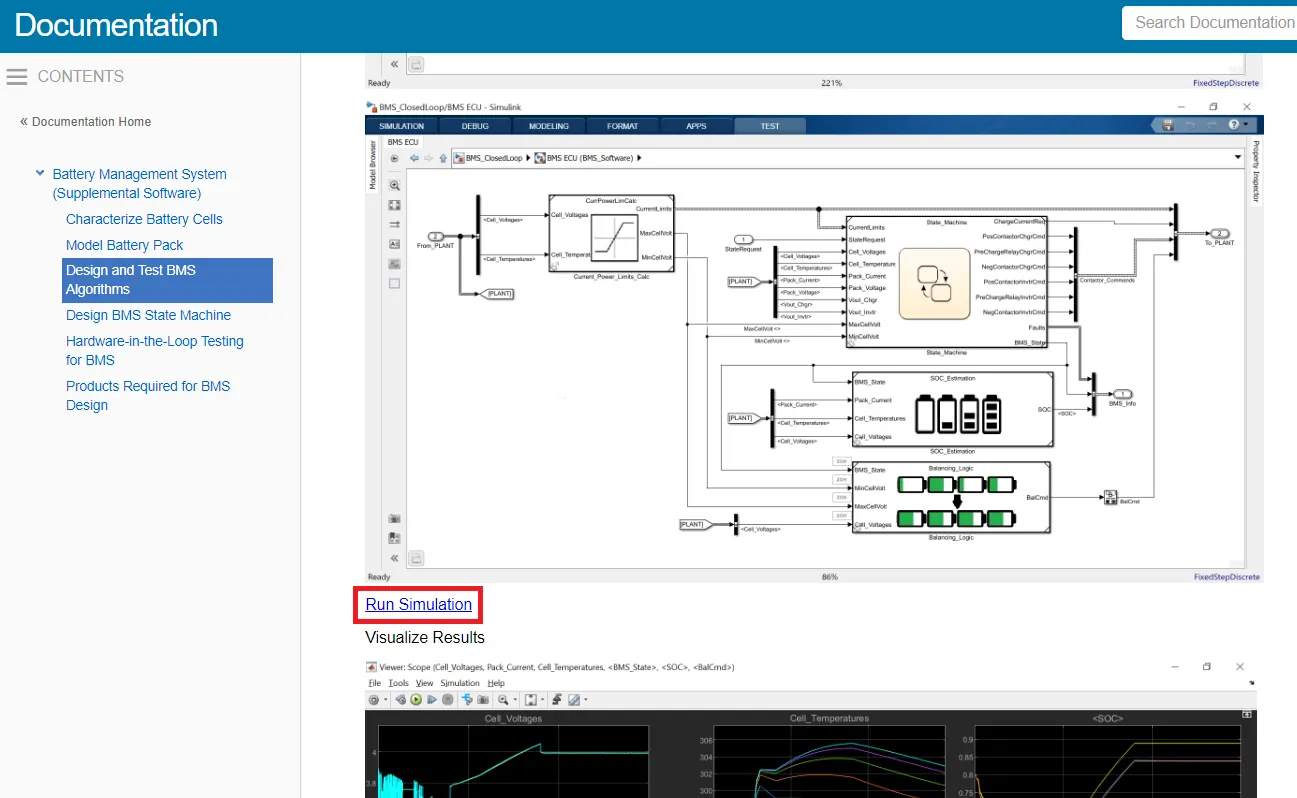
Click on the Design and Test BMS Algorithms option.
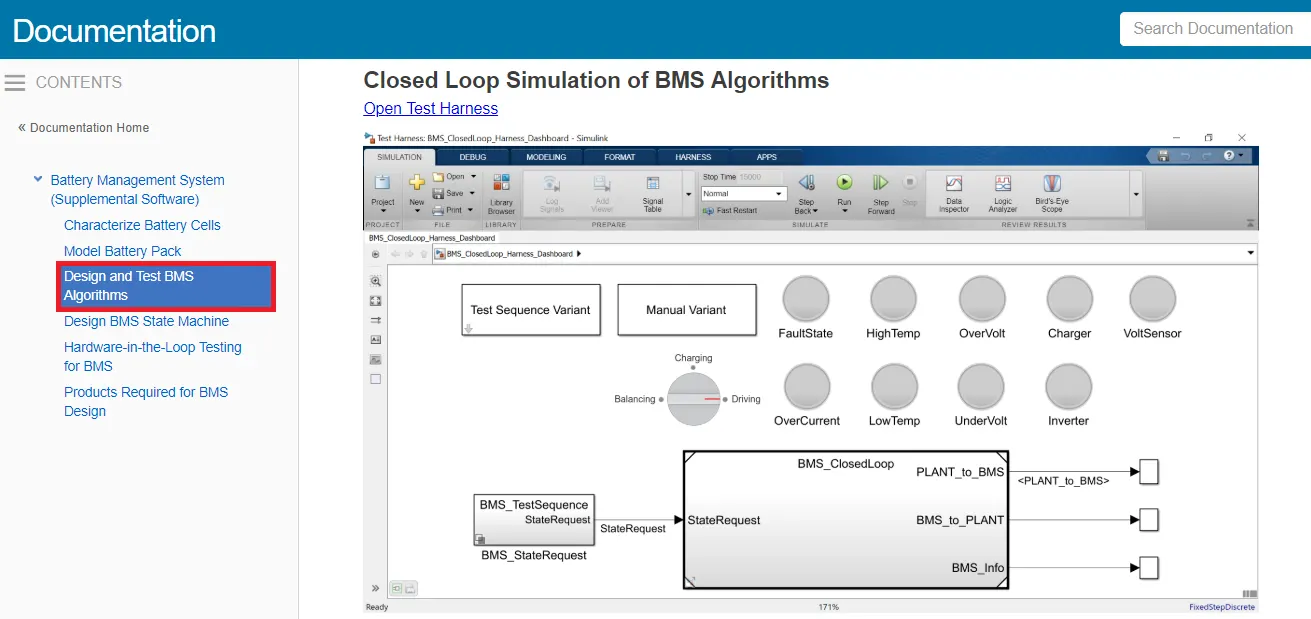
Now we have to open the BMS system and the closed-loop harness dashboard. So, we go back to the MATLAB window and select the BMS System and open the subsystem.
The BMS model consists of a BMS ECU (electrical control unit) and a plant. The control unit with its various monitoring and control algorithms is connected to a block with the representation of the battery pack and associated circuitry and peripherals. This model contains two versions of the battery pack: a small one with just 6 cell series, and a larger 16-module pack, each module containing a 6-cell series string. The architecture is 6s-1p and 96s-1p packs, respectively.
When you click on the BMS ECU, its subsystem opens. Now, click on the state machine.
State Machine defines the main operating state of the BMS. The state machine has four parallel states (parallel meaning that they can be active at the same time):
a.) The first one defines the variable BMS_State which indicates standby, driving, charging, and fault. Charging comprises constant current and constant voltage stages.
b.) The second state switches the fault state ON in case a current, voltage, or temperature value reaches an unsafe level.
c.) The third and fourth states define the contactor ON and OFF switching sequence for the charger and inverter. This is needed to avoid an excessively large current inrush at the beginning of the charging stage.
After opening the BMS system we have to go for the harness dashboard. This dashboard can be selected from the MATLAB window following the procedure shown below.
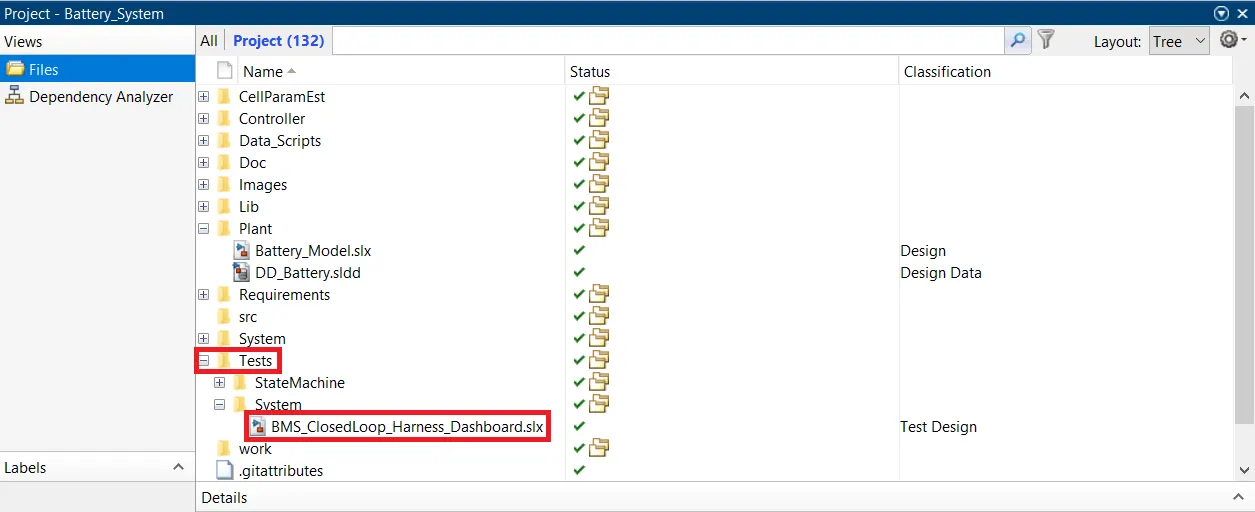
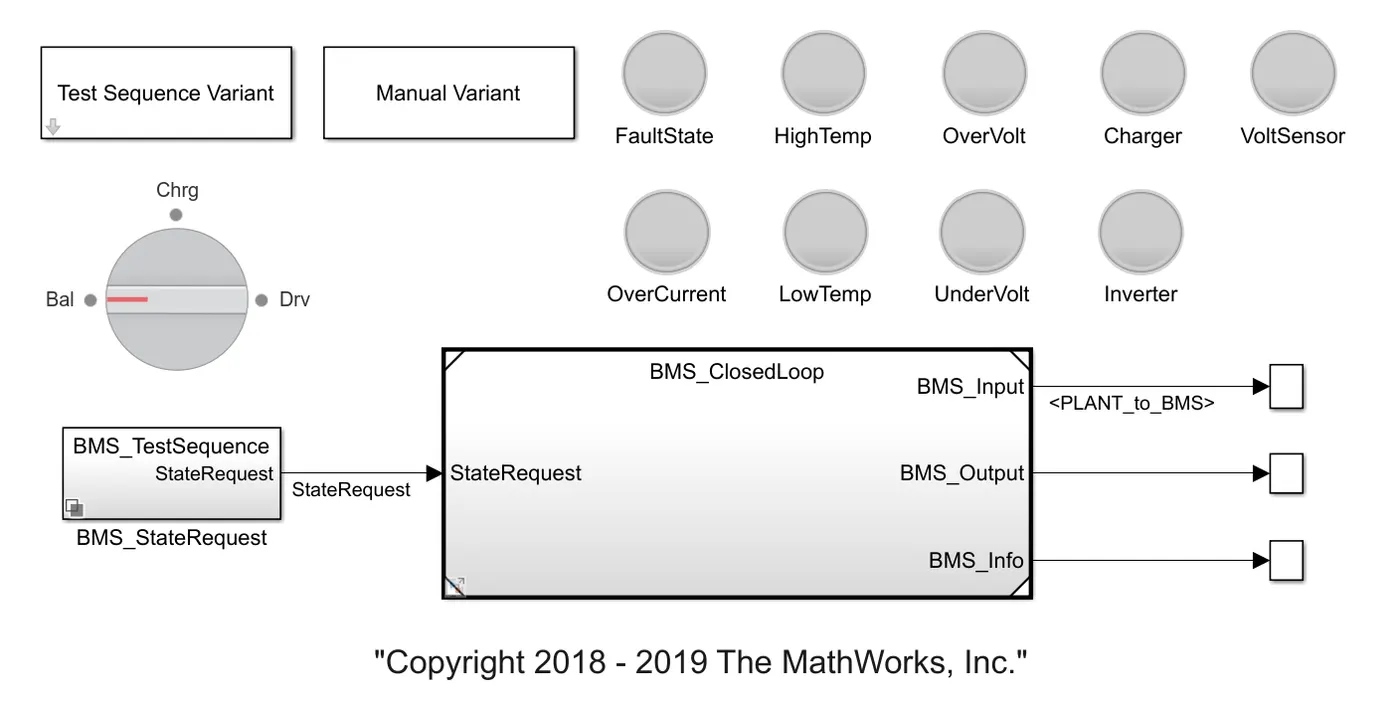
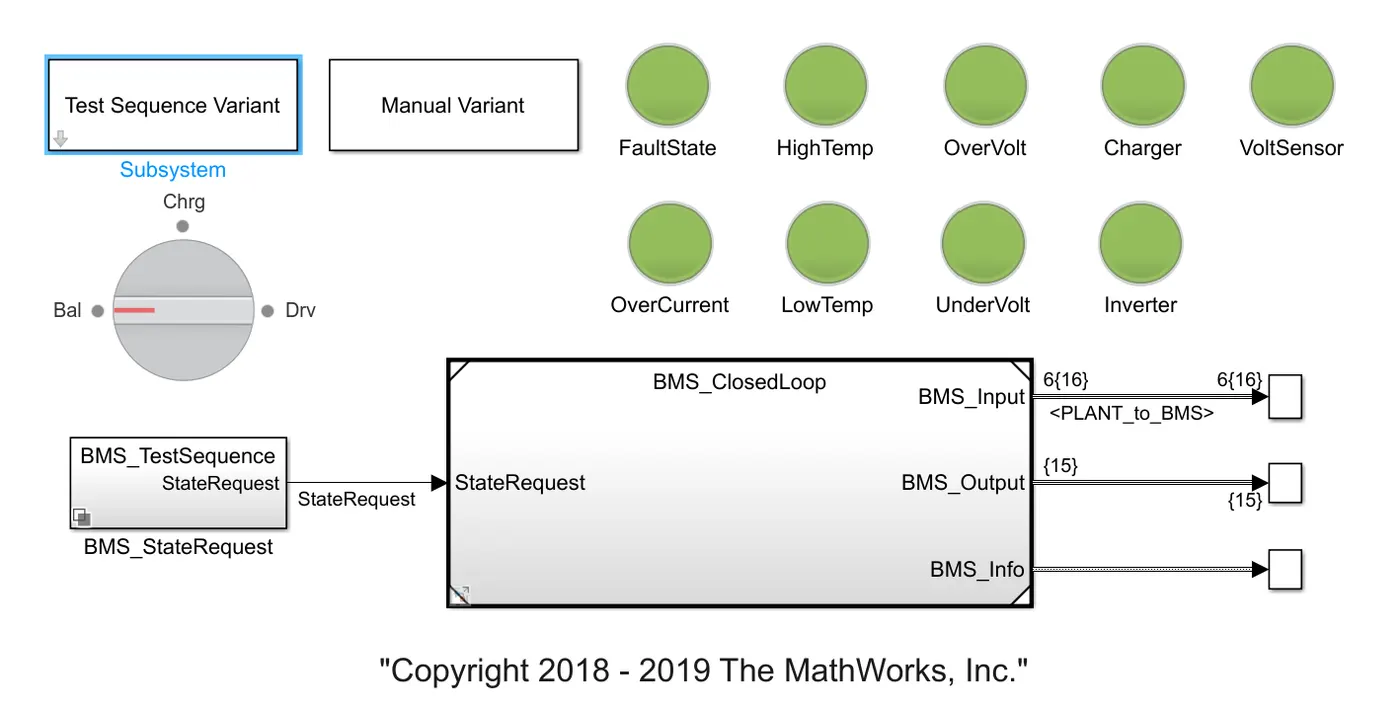
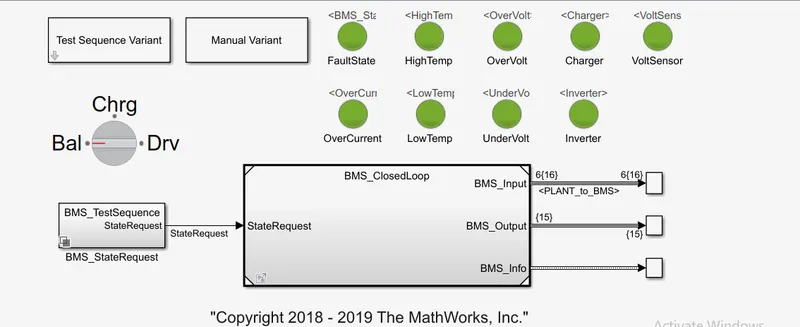
The harness dashboard is shown below. It consists of the test sequence variant subsystem which holda three different test cases. This dashboard also helps in determining the fault states and other parameters as shown in the diagram below. The green colour indicates that the system is working without any errors while the red signal will indicate that there is a fault in the system.
The next step is to go back to the documentation and click on "Run Simulation". This is done to avoid errors while running the model.
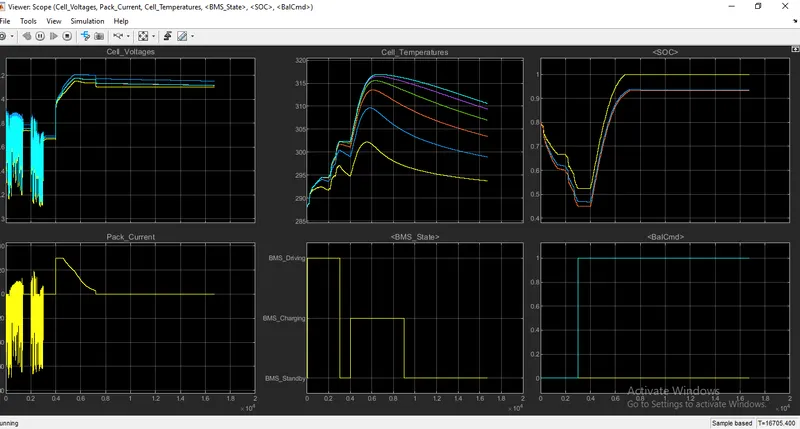
After the compilation is successful the scope opens up. The scope consists of the measurements of cell voltages, cell temperatures, SOC, pack current, BMS State.
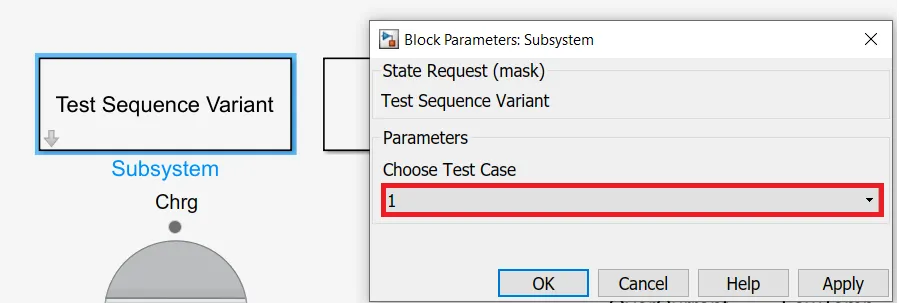
To check the faults in the system we have to go back to the harness dashboard. Here, in the first compilation the test case 1 is selected.
After applying the selected test case, we have to run the simulation. The dashboard shows there are no errors and faults.
If we click on the "BMS_StateRequest" the following system opens up. Now we have to select "BMS_TestSequence".
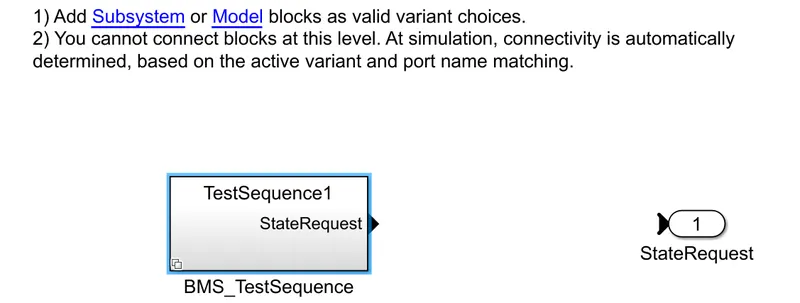
Selecting the first test sequence we can check the conditions for this particular condition.
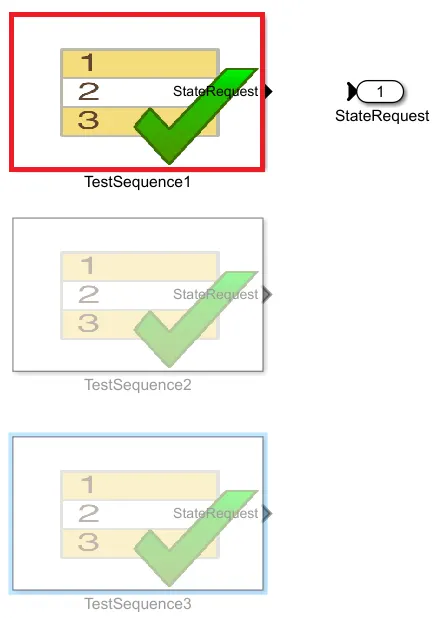
There are three stages of driving condition, namely-
- Driving
- Charging
- Standby
When the simulation begins, initially the vehicle is in a driving state and the SOC will decrease for this time period. After a time period of 3000 seconds, the next step is balancing mode and the vehicle is in standby condition. After another 1000 seconds, the vehicle is in the charging phase and the battery's SOC increases almost to 100%. The next phase is the post charging phase in which the vehicle again goes for the standby mode.

The scope shows the following results for test case 1.
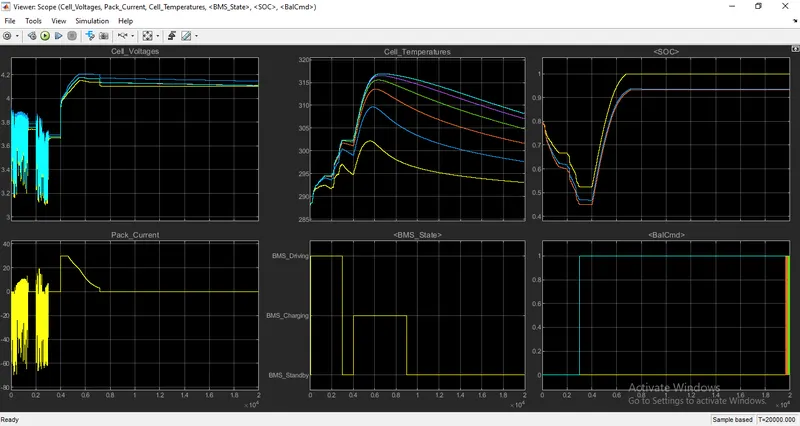
From the scope results, we can define note the following points.
- The input cycle can be seen in the BMS_State plot in which the vehicle initially undergoes driving, then charging till SOC= 90% and then later in the standby state.
- During Charging the Battery pack voltage is increased up to 4.2V.
- The cell temperature increases during the driving and charging cycle and starts falling off in standby mode.
- The SOC drops to less than 50% after the driving cycle and then later put into charging until SOC Reaches 100%.
- The current supplied to the EV during the driving phase can be seen in the current plot.
Now,
we will go for the second test case. For this, we have to go to the test case variant subsystem and select test case 2 from there and click on "Ok". Then we have to run the system for the given simulation time. The result shows that there is a fault condition in the vehicle. The dashboard on the model depicts the same with a red colour indication.
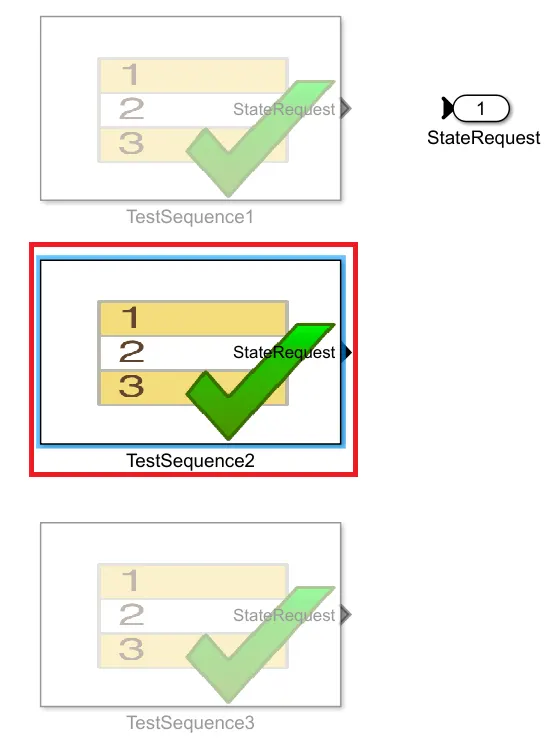
If we click on the "BMS_StateRequest" the following system opens up. Now we have to select "BMS_TestSequence".
Selecting the second test sequence we can check the conditions for this particular condition.
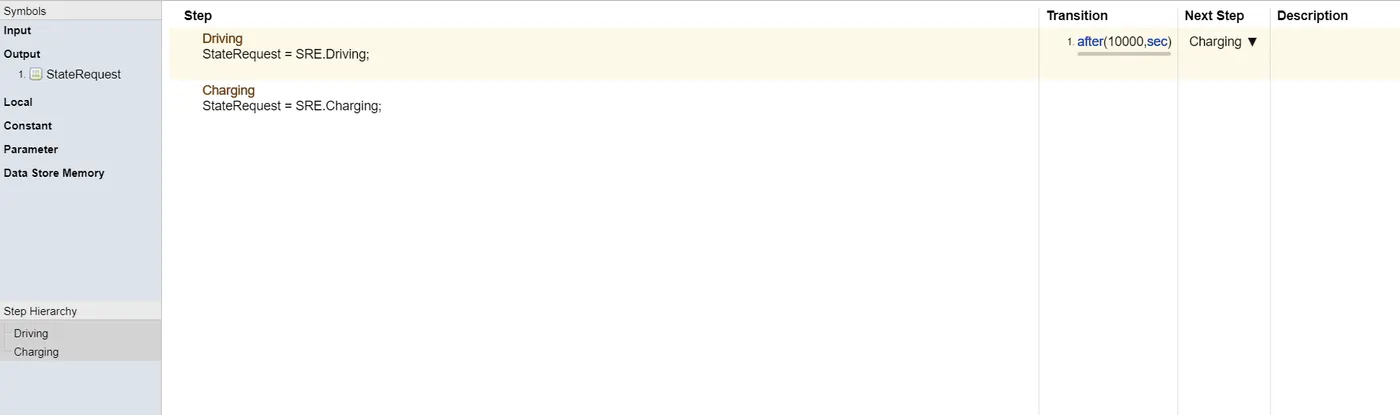
This test case has two Phases for the battery pack, i.e., the Driving and Charging phases.
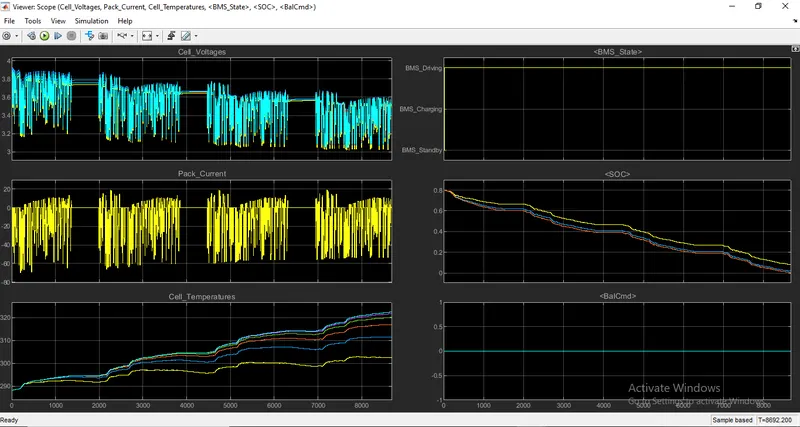
The scope shows the various parameters for the BMS model under the second test case. After 8692 sec it stoped running.
The last test is for the third test sequence. For this, we have to go to the test case variant subsystem and select test case 3 from there and click on "Ok".
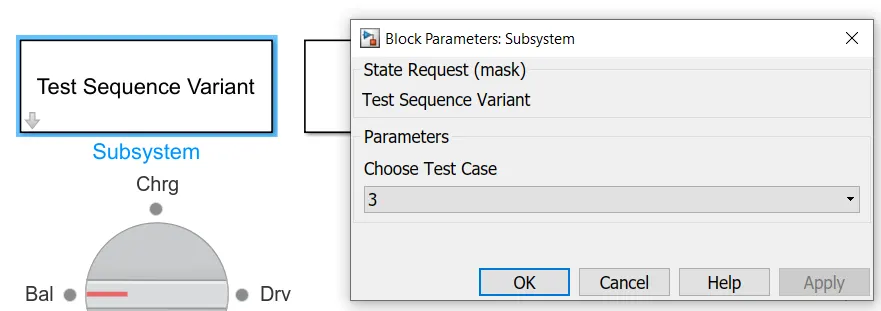
After applying the selected test case, we have to run the simulation. The dashboard shows there are no errors and faults.
If we click on the "BMS_StateRequest" the following system opens up. Now we have to select "BMS_TestSequence".
Selecting the third test sequence we can check the conditions for this particular condition
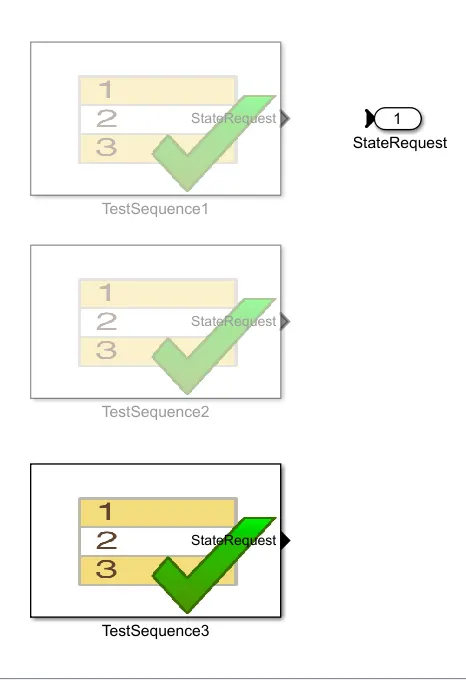
There is only a single phase here for the third test case, i.e. the charging phase.

The scope shows the results for the third test case. Here the SOC increases from 80 to 100% and then remains in standby mode.
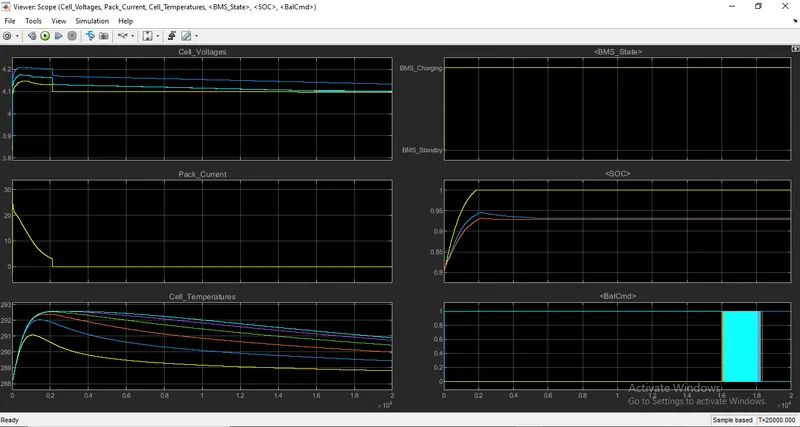
From the scope results we can define note the following points.
- The input cycle can be seen in the BMS_State plot in which the vehicle initially undergoes driving, then charging till SOC= 100% and then later in standby state.
- During Charging the Battery pack voltage is increased upto 4.2V.
- The cell temperature increases during the driving and charging cycle and starts falling off in standby mode.
- The SOC in start was 80% and then later put into charging until SOC Reaches 100%.
- The Current supplied to the EV during driving phase can be seen in the current plot.
he BMS model can be implemented to check the faults and errors using the three different test cases from the harness dashboard.
2.What is coulomb counting? Refer to the above model and explain how BMS implements coulomb counting for SOC estimation ?
COULOMB COUNTING:
Coulomb counting is used in determining or estimating present state of charge of the battery. In general, the SOC of a battery is defined as the ratio of its current capacity (Qt) to the nominal capacity (Qn). The nominal capacity is given by the manufacturer and represents the maximum amount of charge that can be stored in the battery. The SOC can be defined as follows:
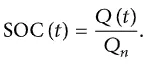
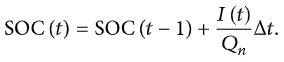
The Coulomb counting method measures the discharging current of a battery and integrates the discharging current over time in order to estimate SOC. Coulomb counting method is done to estimate the SoC(t), which is estimated from the discharging current,I(t), and previously estimated SOC values, SoC(t-1) . SOC is calculated by the following equation:
To improve the Coulomb counting method, a new technique called modified Coulomb counting method is proposed. The modified Coulomb counting method uses the corrected current to improve the accuracy of estimation.
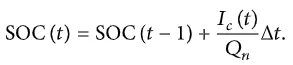
The corrected current is the function of discharging current. There is a quadratic relationship between the corrected current and discharging current of battery. By practice of experimental data, corrected current is calculated by the following form:

where k2, k1 and k0 and are constant values obtained from the practice experimental data.
In modified Coulomb counting method, SOC is calculated by the following equation:
The experimental results show that the accuracy of the modified Coulomb counting method is superior to the conventional Coulomb counting method.
IMPLEMENTATION OF COULOMB COUNTING IN MODEL:
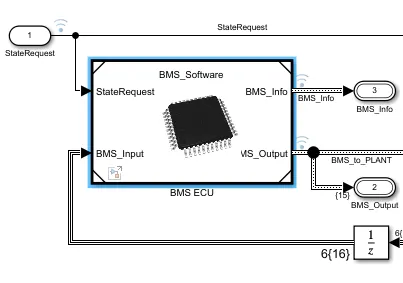
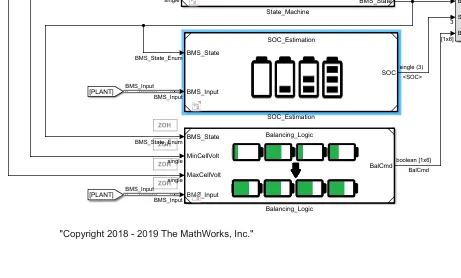
The following block accounts for the SoC estimastion in BMS model.
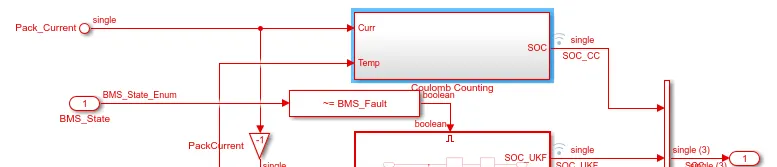
Upon openining subsystem we finally reach the block which implements coulomb counting method.
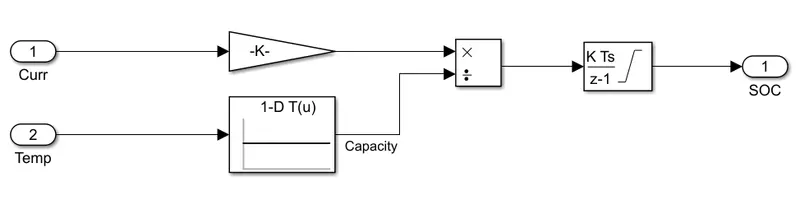
WORKING/IMPLEMENTATION
- Current leaving the cell enters Coulomb counting block.
- The gain block muliplies the current with (1/3600), which is basically converting the current from ampere to Ampere hour.
- As we know that temperature effects the currentand this effect is accounted using 1-D Look up table. Look up table here performs 1-dimensional interpolated table lookup including index searches.
- Divide block then finally characterizes the effect of temerature on current.
- The Coulomb counting method measures the discharging current of a battery and integrates the discharging current over time in order to estimate SOC. This job is done by the integrator block.
- Here Discrete-Time integrator block is used in place of the Integrator block to create a purely discrete model.