Week - 4
Aim:-
Implementing control logic of "Washing Machine" using stateflow.
- When power supply is available the system get activated.
- And when power supply is not available showing it through LED.
- Soakin time is 200s and washing time is 100s.
- After that rinsing for 20s and drying for 50s.
- After completing process turn on the finish light.
Control logic:-
- To input is applied one for power supply and other for water supply.
- Two constant block through which input is fed and controlled through slider switch.
- Input is provided to the chart which is enclosed operation.
- 0 is set for off condition and 1 is for on condition for both.
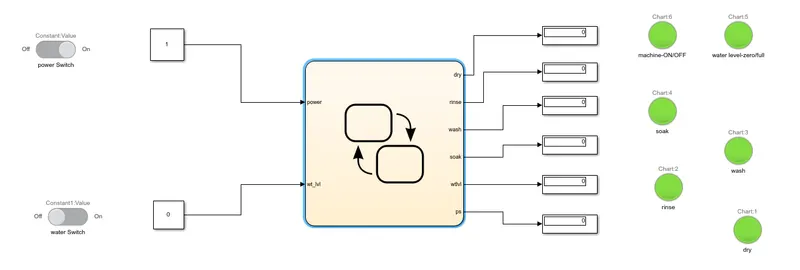
- In output 6 display connected for every operation and further connected to Lamp to show on/off conditions.
- Every display is assign for works like power supply, drying, ransing etc.
- In the flow chart logically work is assign.
- If the power is on and water is on it will further go for soaking, washing, rinsing and drying for time 200s, 100s, 20s, 50s respectively.
- If any of the water or power supply is off it will directly command to end.
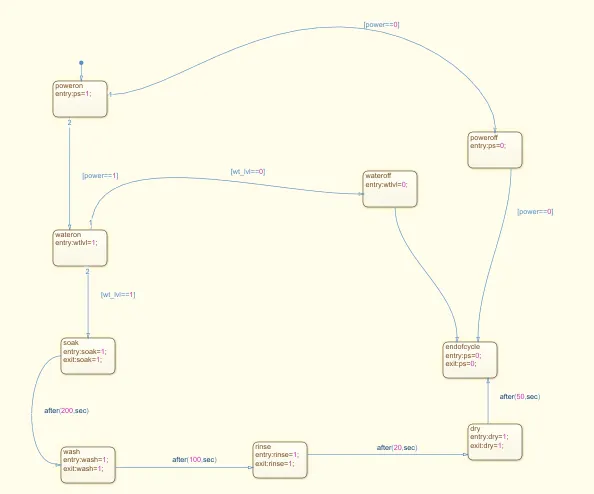
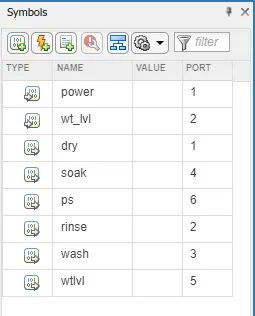
- Symbols and through arrow the procedure is assign.
- Symbols has been given for every work.
Result:-
- When any of the power supply or water supply or both are off output will be OFF.
- When power supply and water supply is ON, first it will run 200s for soaking.
- After that it will run for 100s for washing.
- And further it will run 20s for ransing and 50s for drying.
- After all the procedure it will come to end.
2)
Aim:-
Simulink chart for Gear shift for given conditions.
Given:-
| Speed in range(kmh) | 0 to 15 | 16 to 25 | 26 to 40 | 41 to 60 | 61 and above |
| Gear | 1 | 2 | 3 | 4 | 5 |
Control logic:-
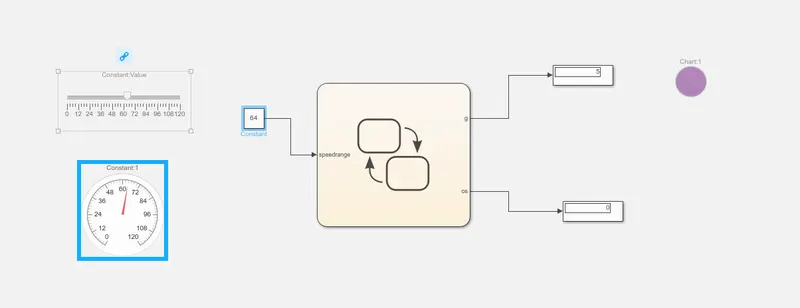
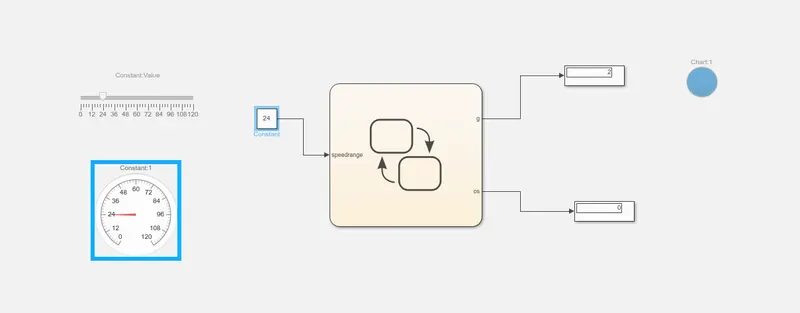
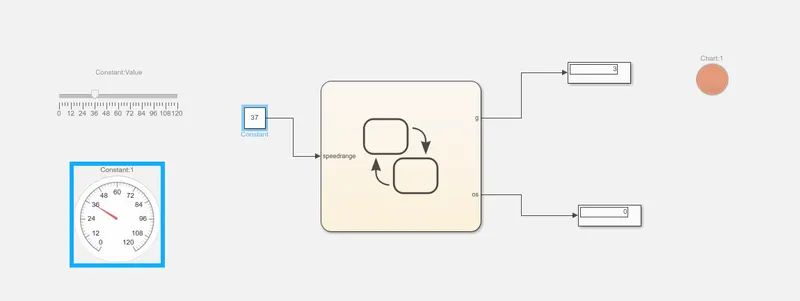
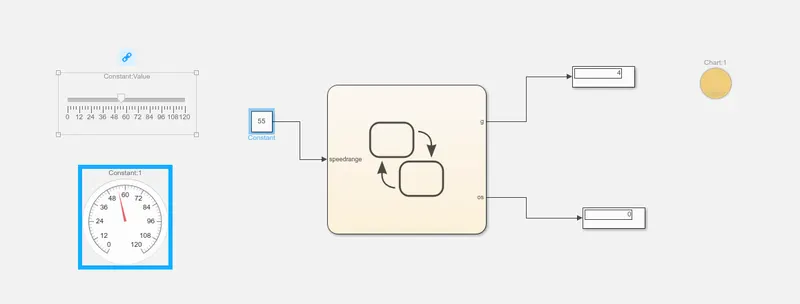
- Constant input which is connected to slider assigned as speed range.
- Speed range is input speed which is connected to chart.
- Two display are connected to the output of chart named g and os.
- Which is further connected to Lamp.
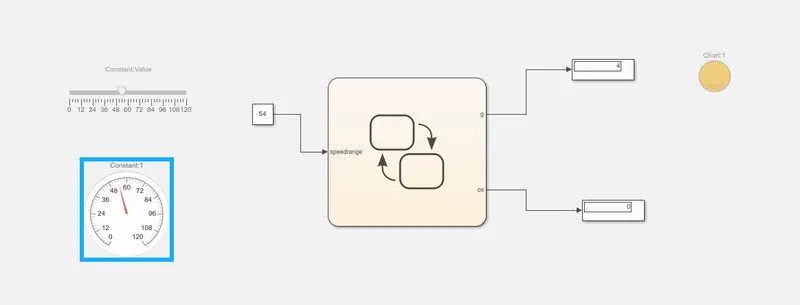
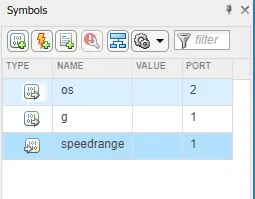
- Symbols are given for input as speed range and output as g and os.
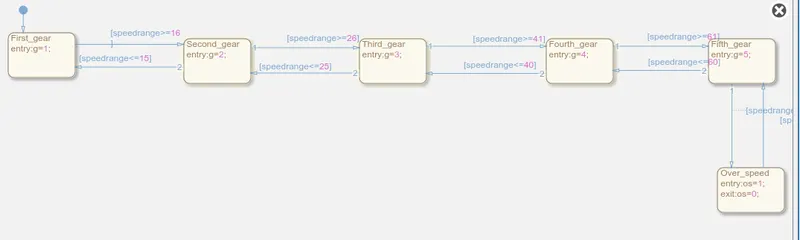
- Insied chart the logic is given for speed range as given below and accordingly assign gear number.
| Speed in range(kmh) | 0 to 15 | 16 to 25 | 26 to 40 | 41 to 60 | 61 and above |
| Gear | 1 | 2 | 3 | 4 | 5 |
Result:-
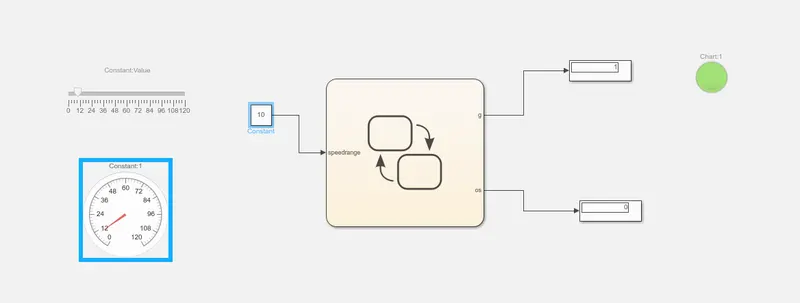
- As the speed increses accordingly gear changes.
When speed is 10
When speed is 24
When speed is 37
When speed is 55
when speed is 64