Week 7: Shock tube simulation project
AIM: To setup a Transient Shock Tube Simulation.
Introduction:
Shock Tube: The shock tube is an instrument used to replicate and direct blast waves at a sensor or a model in order to simulate actual explosions and their effects, usually on a smaller scale. Shock tubes (and related impulse facilities such as shock tunnels, expansion tubes, and expansion tunnels) can also be used to study aerodynamic flow under a wide range of temperatures and pressures that are difficult to obtain in other types of testing facilities.
Shock tubes are also used to investigate compressible flow phenomena and gas phase combustion reactions. More recently, shock tubes have been used in biomedical research to study how biological specimens are affected by blast waves.
A shock wave inside a shock tube may be generated by a small explosion (blast-driven) or by the buildup of high pressures which cause diaphragm(s) to burst and a shock wave to propagate down the shock tube (compressed-gas driven).
Geometry:
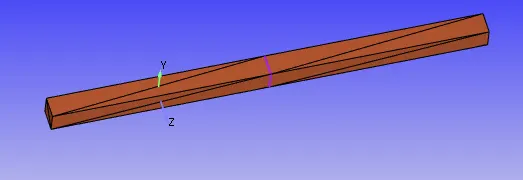
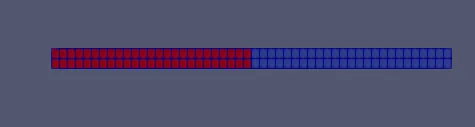
The following is the geometry is used for the simulation.
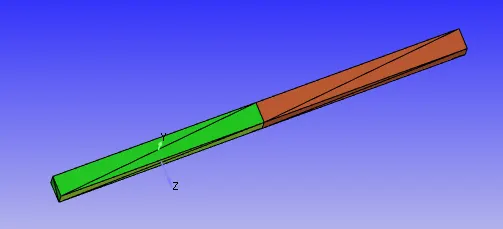
The above geometry is divided into two regions which are Low and High pressure regions are shown below.
Case setup:
- Application Type = Time based
- Materials = selected AIR as predefined mixture under Gas simulation.
- Density based Transient Solver
- Boundary Conditions:
High and Low temperature regions are created and assigned the regions to the boundaries.
Since there is no inlet and outlet all boundaries are selected as WALL
High pressure region species are selected N2 with 600000Pa and O2 for Low pressure region with 101325Pa.
- Events : Because of no boundary between the regions we use EVENTS

- RNG k-Epsilon Turbulence model.
- Grid size = 0.004m
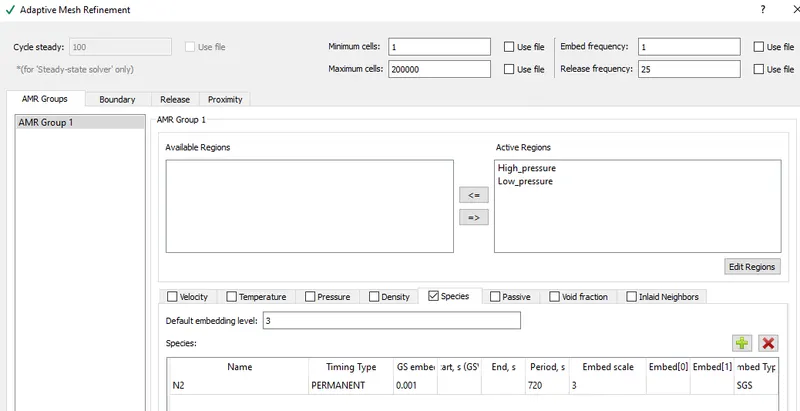
- Adaptive Mesh Refinement:
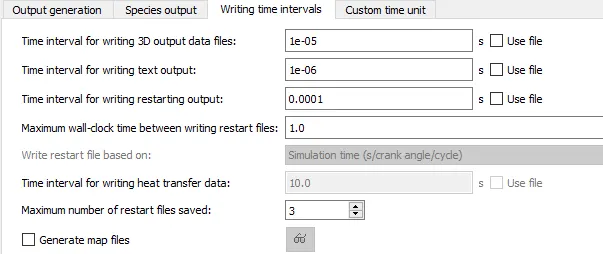
- Output:
Results & Discussion:
Base grid of 0.004m is used in this simulation:
Mesh:
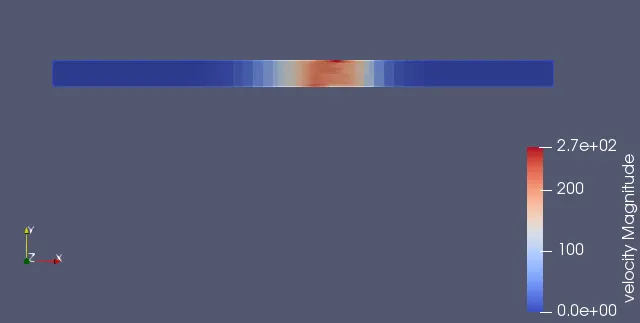
Velocity Contour:
Animation Link:
https://drive.google.com/file/d/1f_TD57t-MT4fu9x2YnNNr3ZdrrCH8sYZ/view?usp=sharing
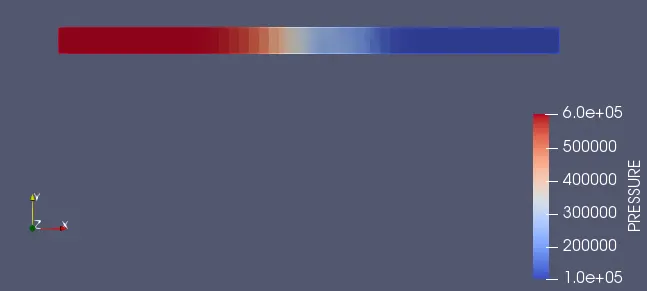
Pressure Contour:
Animation Link:
https://drive.google.com/file/d/1IENKlGiv6dF8c1ETY_QMY2sX9OYUsu1c/view?usp=sharing
Pressure Plot:
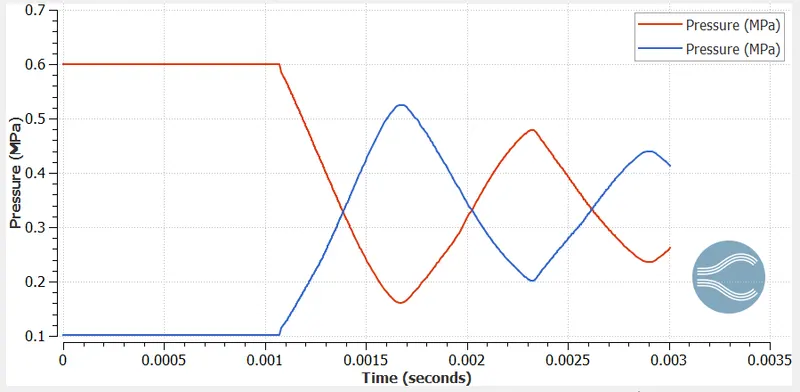
The above plot indicates the pressure of High and Low Pressure areas.
Temperature Contour:
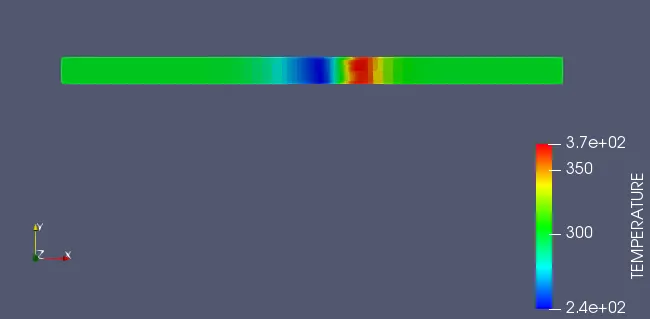
Animation Link:
https://drive.google.com/file/d/12ECXXPxqlM10ppJ_1b7YahS2retst2VU/view?usp=sharing
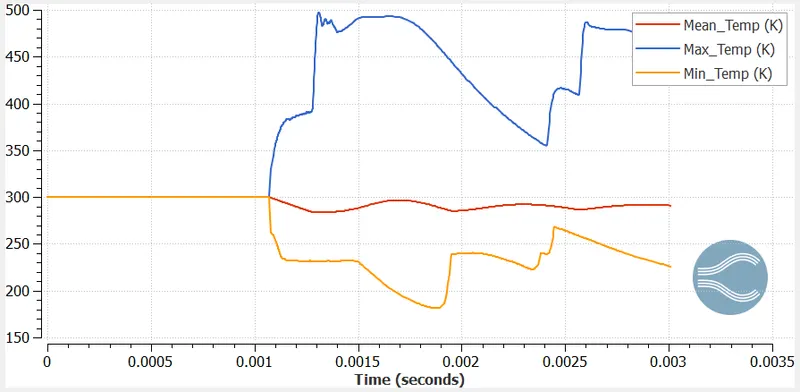
Temperature Plot:
Conclusion:
- The High Pressure(N2) compresses Low Pressure(O2) and formed shock waves are distributed throughout the entire tube.
- Varying of cell count takes place due to Adaptive Mesh Refinement.
- It is observed that the pressure of spcies will become one and gets distributed with respect to time.