Week 7 - Auto ignition using Cantera
Aim: Writing a python code to perform an auto Ignition study on methane by varying the pressure and temperature. And knowing the molar concentration as the ignition takes place.
PART I
simulate the Auto Ignition Time for Methane under the following conditions, (simulation time = 10 secs)
- Plot the variation of Auto Ignition time of Methane with a constant temperature of 1250K and pressure varying from 1 to 5 atm.
- Plot the variation of Auto Ignition time of Methane with a constant pressure of 5 atm and temperature varying from 950K to 1450K.
PART II
observe and print the rate of change of molar concentrations of the given elements "H2O, O2, OH" concerning the time, (simulation time = 10 secs)
Explain the behavior of the graph for 2 cases,
- When Temperature is 1000K and pressure 5 bar
- When Temperature is 500K and pressure 5 bar
Introduction:
During combustion, the time at which the combustion takes place affects the output and life of the engine. The terms that are related to combustion or ignition are Auto-Ignition and Ignition Delay.
The auto-ignition temperature of a substance is the lowest temperature at which it spontaneously ignites in a normal atmosphere without an external source of ignition, such as a flame or spark. Auto-Ignition temperature in an IC engine depends on several factors like the right air-fuel mixture, pollutants in the chamber, Temperature, and pressure. It is quite important to know the Auto-ignition temperature of the fuel so that parameters can be controlled accordingly. The autoignition temperature of gasoline is higher than diesel. Lower the autoignition temperature easier it is to start ignition.
Ignition delay is the time required for the chemical reaction(combustion) to take place exponentially. Though the delay is very short (in milliseconds or microseconds ), it plays a significant role in combustion efficiency. Ignition delay depends on the factors like Initial Temperature, pressure, Rich, lean or stoichiometric mixture. Ignition delay affects the cycle and causes energy loss or sometimes damages the engine. Different fuels have various ignition delays, there are experimental ways to determine the ignition delay of a specific fuel like shock tube test and Rapid compression machine.
Given condition:
`Time_(Ignition Delay) = Time_(Initial Temperature) + 400K`
Auto Ignition time is the time when the temperature of the reactor is Initial Temperature plus 400K.
Part 1:
variation of Auto Ignition time of Methane with a constant temperature of 1250K and pressure varying from 1 to 5 atm.
Required modules and libraries are imported. Initial values are defined and gas object instance is created with the solutions object. Then the temperature pressure and moles of the species are defined. r object with the idealGasreactor object of gas is created. sim object is created with r in the reactor net class. Then statesarray class of gas is assigned to states which gives the state of the reactor object. temperature is kept constant and the pressure is varied using for loop. Inside the for loop another for loop is used to loop simulation time if condition is used to store the time and temperature values if the Initial temperature is greater than (initial temperature + 400k
Python code:
#Ignition Delay (Constant temperature)
import sys
import numpy as np
import cantera as ct
import matplotlib.pyplot as plt

gas = ct.Solution('gri30.xml')
T =1250
P_start = 1*101325
P_final = 5*101325
sim_time =10000
patm = 101325

pressure = np.linspace(P_start,P_final,5)
ignition_delay =[]
pr = 0
#for P in range(P_start,P_final):
for P in pressure:
	pr =pr+1
	gas.TPX = T,P,{'CH4':1,'O2':2,'N2':7.52}
	r = ct.IdealGasReactor(gas)
	sim = ct.ReactorNet([r])
	time = 0
	T_old = T
	states =ct.SolutionArray(gas, extra = ['t'])
	for i in range(sim_time):
		time += 1e-3
		sim.advance(time)
		states.append(r.thermo.state,t = time)
		T_new = states.T
		#Condition for getting Auto ignition time and pressure
		if  ((T_new[i]-T_old) <= 400 ):
			t = states.t[i]
			pre = states.P[i]

	plt.figure(1)
	plt.plot(states.t, states.T,label='%d bar'%pr)
	plt.title('Temperature vs Time')
	plt.legend()
	plt.xlabel('Time [s]')
	plt.ylabel('Temperature(k)')
	ignition_delay.append(t)

#plotting of pressure vs ignition delay
plt.figure(2)
plt.plot((pressure/patm),ignition_delay,'-*',color='cyan')
plt.title('Ignition delay vs Pressure')
plt.xlabel('pressure(bar)')
plt.ylabel('Ignition delay(s)')
plt.show()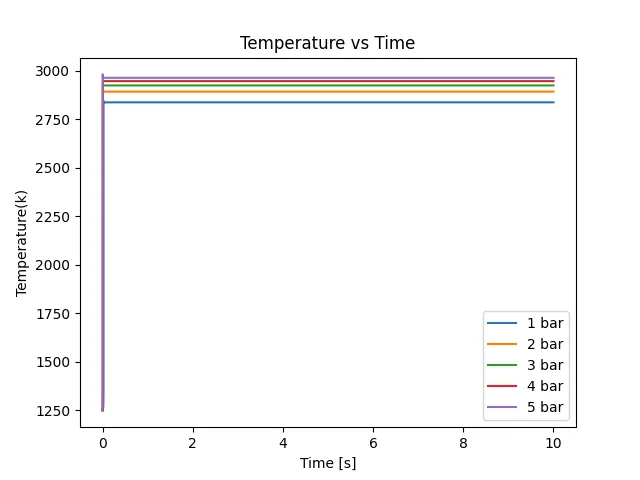
the chamber with higher pressure has a higher auto-ignition temperature. It is seen in the plot that if the pressure is 1 bar then the autoignition temperature is low compared to the 5 bar.
variation of Ignition delay vs pressure
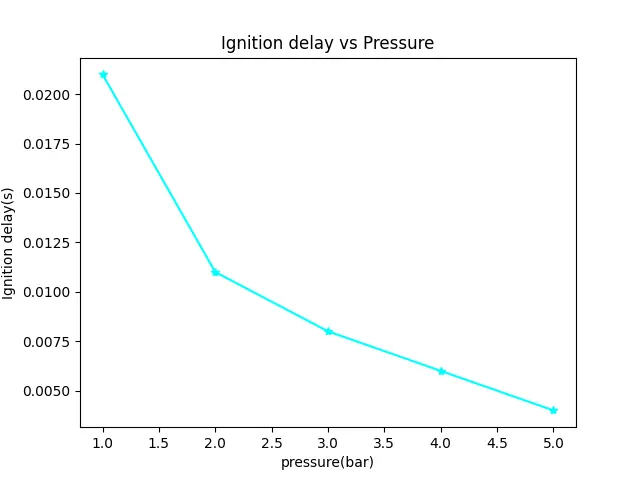
With the increasing pressure ignition delay decreases
Plot the variation of Auto Ignition time of Methane with a constant pressure of 5 atm and temperature varying from 950K to 1450K.
The code for constant pressure is also the same except that the pressure is kept constant and temperature is varied. Loop is performed for temperature.
Python code:
#Ignition Delay (Constant pressure)
import sys
import numpy as np
import cantera as ct
import matplotlib.pyplot as plt

gas = ct.Solution('gri30.xml')
T =1250
T_start = 950
T_final = 1450
sim_time =10000
P = 5*101325

Temperature = np.linspace(T_start,T_final,5)
ignition_delay =[]
temp_f =[]
#for P in range(P_start,P_final):
for T in Temperature:
	gas.TPX = T,P,{'CH4':1,'O2':2,'N2':7.52}
	r = ct.IdealGasReactor(gas)
	sim = ct.ReactorNet([r])
	time = 0
	T_old = T
	states =ct.SolutionArray(gas, extra = ['t'])
	for i in range(sim_time):
		time += 1e-3
		sim.advance(time)
		states.append(r.thermo.state,t= time)
		T_new = states.T
                #Condition for getting Auto ignition time and temperature
		if  ((T_new[i]-T_old) <= 400 ):
			t = states.t[i]
			temp = states.T[i]
	plt.figure(1)
	plt.plot(states.t, states.T,label='%d K'%T)
	plt.title('Temperature vs Time')
	plt.legend()
	plt.xlabel('Time [s]')
	plt.ylabel('Temperature [K]')
	ignition_delay.append(t)
	temp_f.append(temp)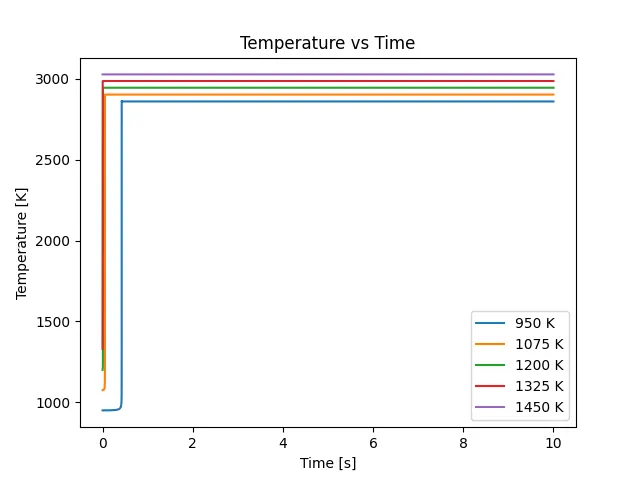
variation of Ignition delay vs Temperature
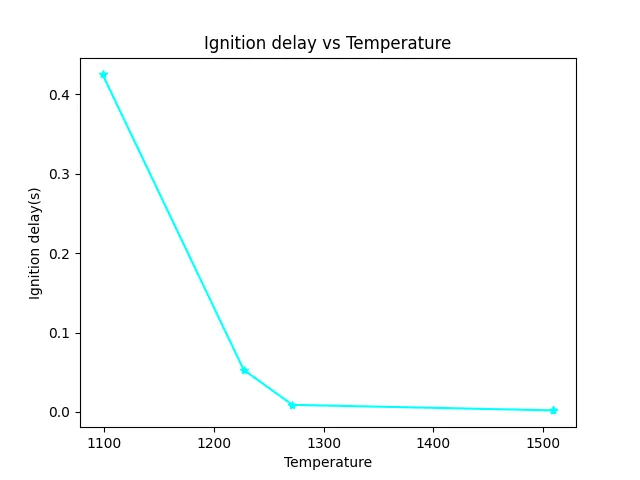
The ignition delay is decreased with the increasing temperature
Conclusion for part 1:
The ignition delay is reduced with the increase in temperature and pressure. Temperature and pressure are directly proportional to ignition delay.
Part 2:
Required modules and libraries are imported. Initial values are defined and gas object instance is created with the solutions object. Then the temperature pressure and moles of the species are defined. r object with the idealGasreactor object of gas is created. sim object is created with r in the reactor net class. Then statesarray class of gas is assigned to states which gives the state of the reactor object. For loop is used for the change in the time and states and this data is appended to states. After that required plotting is done.
Python code:
#Molar concentration at 1000 and 500k
import sys
import numpy as np
import cantera as ct
import matplotlib.pyplot as plt

#Defining the inoitial values
T =500
P = 5*101325
sim_time =10000
molar_conc = []
time = 0
#creating object instances
gas = ct.Solution('gri30.xml')
gas.TPX = T,P,{'CH4':1,'O2':2,'N2':7.52}
r = ct.IdealGasReactor(gas)
sim = ct.ReactorNet([r])
states =ct.SolutionArray(gas,extra = ['t_ms','t'])
#looping for the time and states
for i in range(sim_time):
	time += 1e-3
	sim.advance(time)
	states.append(r.thermo.state, t_ms = time*1e3,t = time)
#plotting
plt.subplot(3,1,1)
plt.title('Molar concentration of H2O,O2 and OH at 500k vs Time')
plt.plot(states.t,states.X[:,gas.species_index('H2O')],'cyan')
plt.ylabel('H2O')

plt.subplot(3,1,2)
plt.plot(states.t,states.X[:,gas.species_index('O2')],'red')
plt.ylabel('O2')

plt.subplot(3,1,3)
plt.plot(states.t,states.X[:,gas.species_index('OH')],'blue')
plt.xlabel('time')
plt.ylabel('OH')

plt.subplots_adjust(left=0.1,bottom=0.1,right=0.9,top=0.9,wspace=0.5,hspace=0.4)
plt.show()
The python code for both the subcases are the same except that the temperature is varied
The temperature at 500k and pressure at 5 bar:
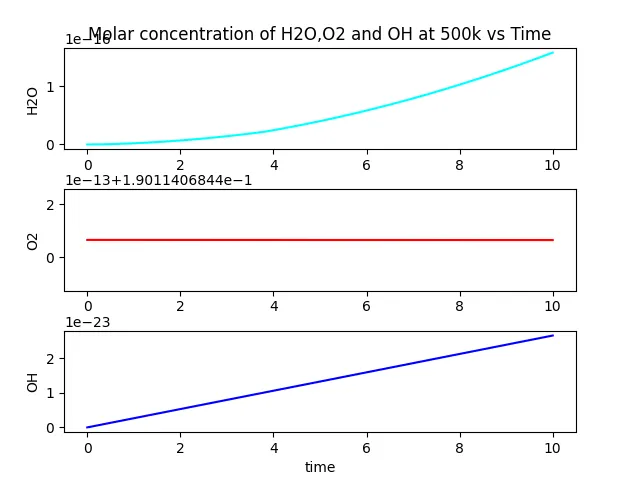
As 500k is not a sufficient temperature for the ignition there won't be any significant chemical changes or reactions takes place. So the oxygen molar concentration is constant 500k this is because the oxygen values drop only when the combustion takes place.
The temperature at 1000k and pressure at 5 bar:
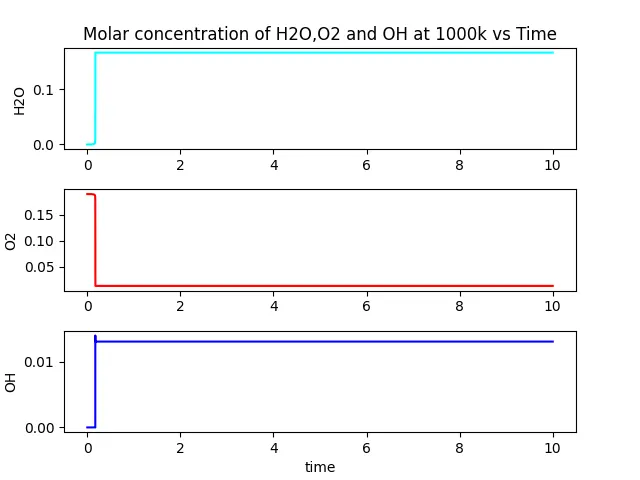
At 1000k the combustion takes place in microseconds and from the plots, it is evident that the molar concentration of different species changes sharply. The molar concentration of oxygen is dropped due to the fact that oxygen utilized in combustion. The OH and H20 concentrations are increased sharply microseconds after the temperature rise.