Week 6 - Data analysis
“File Parsing” is a process where data is methodically extracted for the purpose of analysis and visualisation. It is of great importance in scientific and engineering communities and it helps in organising and understanding large amounts of empirical data.
In practical terms, here are some advantages of file parsing:
1) Facilitates Data Integration: Parsing helps knit together data from diverse sources, enabling harmonious functioning of multiple systems or applications.
2) Enables Advanced Data Analytics: Neatly parsed and structured data allows organizations to use more complex analytical tools, leading to deeper insights and robust forecasting capabilities.
3) Reduces Costs: Efficient file parsing lowers operating costs by minimizing the need for manual data entry and correction.
Formulae Used in the Code:
Work Done per Cycle=Area under the ‘P-V’ curve ...[in Joules]
Power Output=`P=W_(out)*n/(2*60)`
Where, “`W_(out)`” is the work output per cycle (in joules) , “`n`” is the rpm.
Specific Fuel Consumption`=(fc)/P*n/(2*60)*3600*1000` ...[in `(Kg)/(Kw*hr)`]
Here, “`fc`” is the fuel consumed (in Kg) per stroke cycle.
Code: (with comments explaining each step)
from scipy.integrate import trapezoid
import matplotlib.pyplot as plt
import sys
lct=1
rpm=1500 #given data
fuel_cons=20*pow(10,-9)
stroke_cycle=(rpm/60)*0.5
#Compatibility Check...
for line in open("engine_data.out","r"):
if(lct>5 and lct<8671):
if (len(line.split())!=17):
print("File is not compatible...")
sys.exit()
lct+=1
print("File is compatible")
#Function to visualise data, Data Visualiser:
def plotData(c1,c2):
lc=1 #Initialising line counter
#Initialising empty arrays
c1_arr=[]
c2_arr=[]
for line in open("engine_data.out","r"):
data_set=line.split()
if (lc==3):
ylab=str(data_set[c2])
xlab=str(data_set[c1])
if (lc>5):
c1_arr.append(float(data_set[c1-1])) #Must subtract '1'' from column numbers
c2_arr.append(float(data_set[c2-1])) #to get the indexing right
lc+=1
#Plotting:
plt.plot(c1_arr,c2_arr)
plt.xlabel(xlab)
plt.ylabel(ylab)
plt.title(xlab+" vs "+ylab)
plt.show()
#Function to fetch data from the file:
def fetchData(c1,c2):
lc=1
c1_arr=[]
c2_arr=[]
for line in open("engine_data.out","r"):
data_set=line.split()
if (lc==3):
xlab=data_set[c1]
ylab=data_set[c2]
if (lc>5):
c1_arr.append(float(data_set[c1-1])) #Must subtract '1'' from column numbers
c2_arr.append(float(data_set[c2-1])) #to get the indexing right
lc+=1
return [c1_arr,c2_arr,xlab,ylab]
plotData(8,2) #calling the "plotData" function...
plotData(1,8) #calling the "plotData" function...
#Basic Performance Calculations:
volume,pressure,x,y=fetchData(8,2)
area_pv=(trapezoid(pressure,volume))*pow(10,6)
print("Approximate area under the PV graph (using the trapezoid rule) ",area_pv,"Joule/Cycle")
power_output=area_pv*rpm/(2*60) #in watts
print("Power output is: ",power_output,"Watts")
sfc=((fuel_cons/power_output)*stroke_cycle)*3600*1000
print("Specific fuel consumption is ",sfc,"Kg/(kw*hr)")
Results:
Output from the code:

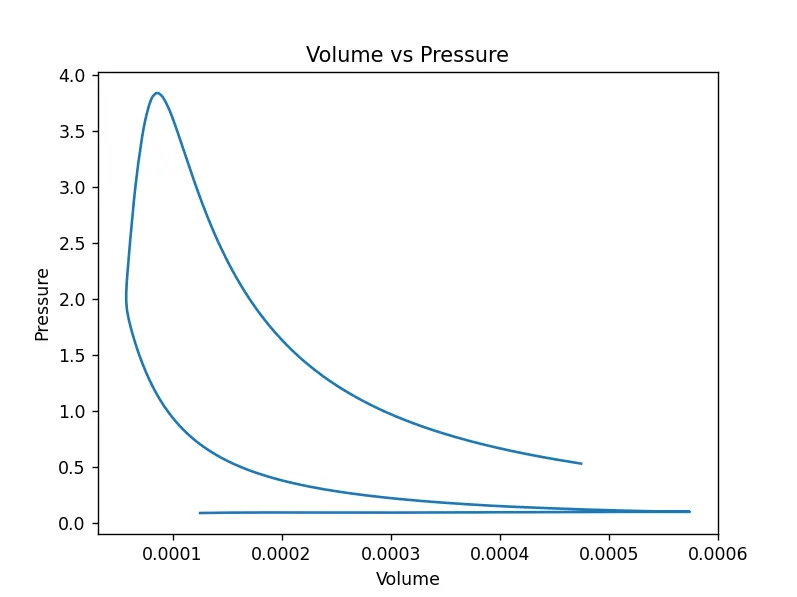
Plot of “Volume vs Pressure”: (from the user defined function, “plotData(8,2)"):
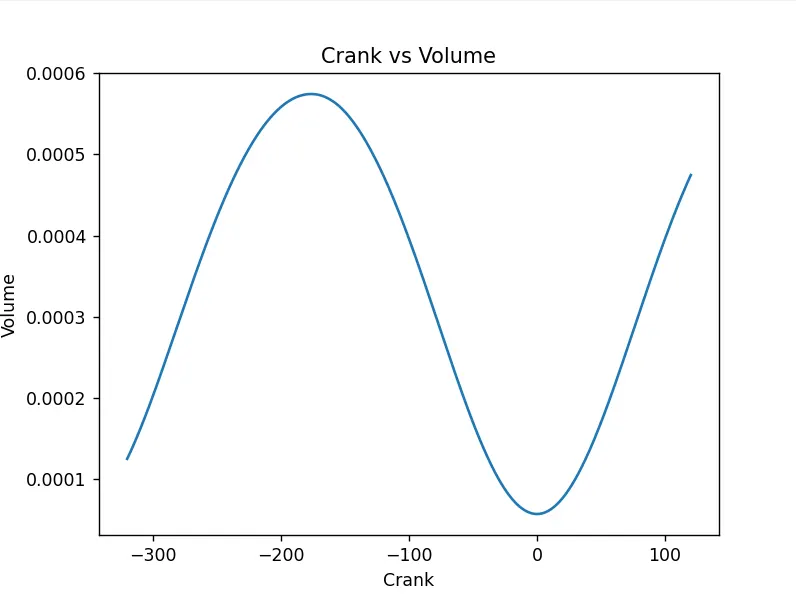
Plot of “Crank vs Volume”: (from the user defined function, “plotData(1,8)"):