Week 6 - Data analysis
AIM:
Take a look at the data analysis video before you attempt this challenge.
Your task is to write a script that does a data visualizer, compatibility check, and Basic performance calculation.
OBJECTIVES:
Data visualizer
- Your script should take column numbers as the input and plot the respective columns as separate images
- Each file should be saved by the name of the column
- The plot labels should be extracted from the file. If, I request for a plot between column 1 (crank angle) and column 8(volume), then the label information should automatically be extracted and must appear as labels in the plots. THIS SHOULD NOT BE DONE MANUALLY
Compatability check
- You code should exit gracefully, if a non-compatible file is provided as an input. It should say something like "File not recognized. Please provide a valid CONVERGE output file"
Basic performance calculation
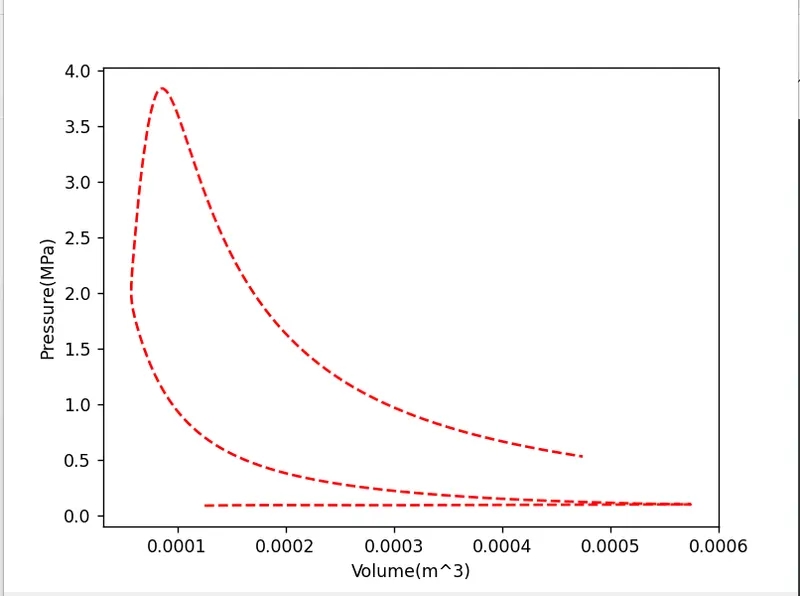
- Calculate the area under the P-V diagram. P is in column 2 and V is in column 8.
- Calculate the power output of this engine. Assume that RPM is 1500
- This engine consumed 20 micro grams of fuel (per 1 stroke cycle). Calculate its specific fuel consumption.
THEORY.
Data analysis is a process of inspecting, cleansing, transforming, and modeling data with the goal of discovering useful information, informing conclusions, and supporting decision-making. Data analysis has multiple facets and approaches, encompassing diverse techniques under a variety of names, and is used in different business, science, and social science domains. In today's business world, data analysis plays a role in making decisions more scientific and helping businesses operate more effectively.
- Descriptive Analysis.
- Diagnostic Analysis.
- Predictive Analysis.
- Prescriptive Analysis.
The data file given and consists of various parameters of an engine. We have to calculate the below parameters
1] Work done by the engine is obtained by calculating the area under the P-V diagram
2] Power output of the engine is given below
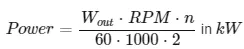
n - Number of cylinders of the engine, RPM - engine speed in minutes,WOut - Work output by the engine
3] Specific Fuel Consumption(SFC)

SFC = mass of fuel consumption / Engine brake power = FC / Pb
THE CODE
# Project data analysis

import math
import matplotlib.pyplot as plt
import numpy as np
from prettytable import PrettyTable

#input data
try:
	data = open('engine_data.out','r')
	print('File opened successfully')
except FileNotFoundError:
	print('File not recognized. Please provide a valid CONVERGE output file')


#Creating empty array for all the paramers

crank = []
Pressure = []
max_Pres = []
Min_pres =[]
Mean_temp = []
Max_temp =[]
Min_temp = []
Volume= []
Mass = []
Density=[]
integrated_HR = []
HR_rate = []
C_p =[]
C_v = []
Gamma = []
Kin_visc = []
Dyn_visc=[]

for line in open('engine_data.out'):
	if '#' not in line:
		crank.append(float(line.split()[0]))
		Pressure.append(float(line.split()[1]))
		max_Pres.append(float(line.split()[2]))
		Min_pres.append(float(line.split()[3]))
		Mean_temp.append(float(line.split()[4]))
		Max_temp.append(float(line.split()[5]))
		Min_temp.append(float(line.split()[6]))
		Volume.append(float(line.split()[7]))
		Mass.append(float(line.split()[8]))
		Density.append(float(line.split()[9]))
		integrated_HR.append(float(line.split()[10]))
		HR_rate.append(float(line.split()[11]))
		C_p.append(float(line.split()[12]))
		C_v.append(float(line.split()[13]))
		Gamma.append(float(line.split()[14]))
		Kin_visc.append(float(line.split()[15]))
		Dyn_visc.append(float(line.split()[16]))


Title = []
Units = []
L_c = 1
for line in open('engine_data.out'):
	if L_c == 3:
		Title.append(line.split())
	if L_c == 4:
		Units.append(line.split())

	L_c+=1

t = [0,1,2,3,4,5,6,7,8,9,10,11,12,13,14,15,16]

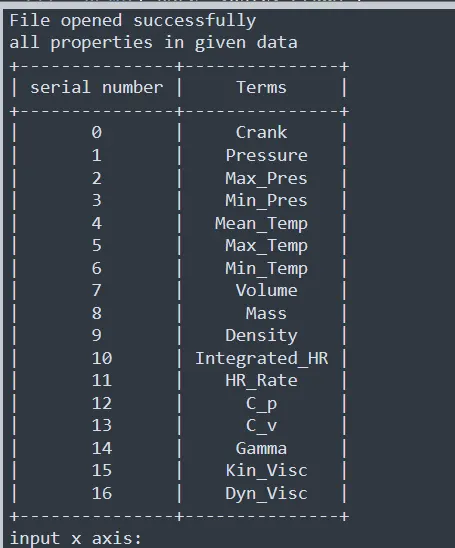
print('all properties in given data')

table = PrettyTable(['serial number','Terms'])
for i in range(0,len(t)):
	table.add_row([t[i],Title[0][i+1]])

print(table)

a = [crank,Pressure,max_Pres,Min_pres,Mean_temp,Max_temp,Min_temp,Volume,Mass,Density,integrated_HR,HR_rate,C_p,C_v,Gamma,Kin_visc,Dyn_visc]
x= int(input('input x axis: '))
y = int(input('input y axis: '))

plt.plot(a[x],a[y],'r--')
plt.xlabel(Title[0][x+1]+ Units[0][x+1])
plt.ylabel(Title[0][y+1]+ Units[0][y+1])
plt.show()

Pressure = np.array(Pressure)*1e6
Volume = np.array(Volume)
area_under_pv = np.trapz(Pressure,Volume)

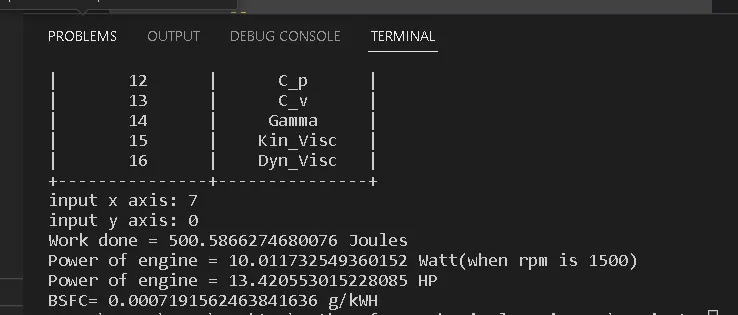
print('Work done =',area_under_pv, 'Joules')
rpm = 1500
time_of_one_rev = rpm/60

one_cycle = 2*time_of_one_rev
power = area_under_pv/one_cycle
print('Power of engine =',power, 'Watt(when rpm is 1500)')
print('Power of engine =',power/0.746, 'HP')

#Calculating bsfc
m = 2*pow(10,-6)
bsfc = (3600*m)/power
print('BSFC=',bsfc,'g/kWH')
THE STEPS:
Import the useful modules like numpy , math . mathplotlib etc.
Using try and except we check the compatibility of the file and give the appropriate output for the check result.
For the purpose of plotting the curves between 2 quantities as per the user input, a line counter is initiated from data file and Now an "if" loop is iterated with the condition if '#' not in line all the numerical values present in the data file is now to be stored in the data array as string. Now another "if" loop is executed with the conditon that line counter greater than or equal to 6 all the data will be stored in the parameter empty array one by one using line split.
Ttile and units are stored separately using the linesplit and append command.
For power calculation the area under the curve is calculated and the equated as per the equation described on theory part.
the area under the PV diagram has to be calculated and we are using Simpson method .
THE RESULT:
Comptability check screenshot and parameter column and number for selection.
Plot between Pressure vs volume
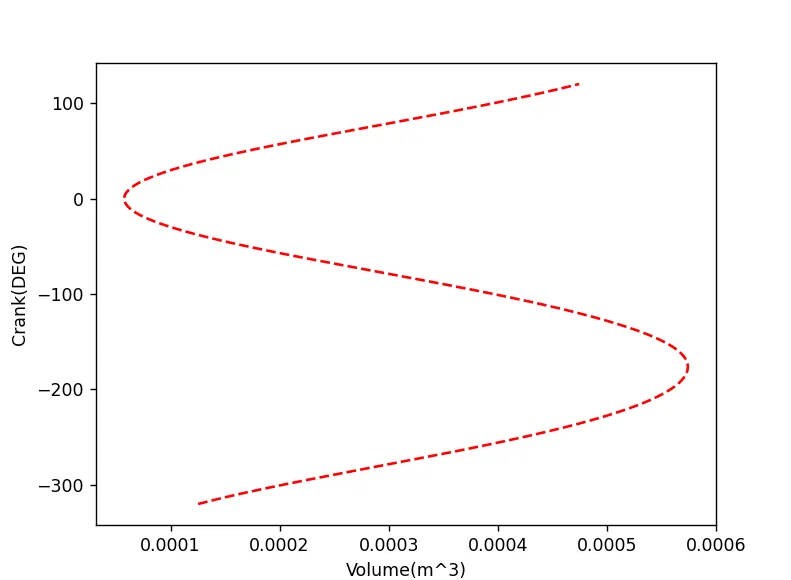
Plot between Volume vs crank
Power output and specific fuel calculation.
CONCLUSION:
The python code run successfully and the plots are obtained along with the calculation.