Week 6 - Data analysis
1.Data visualizer
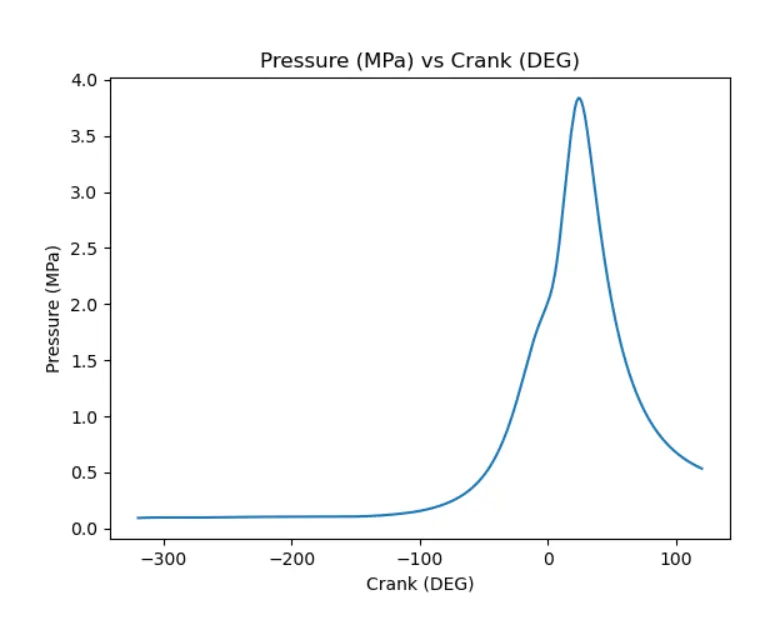
- Your script should take column numbers as the input and plot the respective columns as separate images
- Each file should be saved by the name of the column
- The plot labels should be extracted from the file. If, I request for a plot between column 1 (crank angle) and column 8(volume), then the label information should automatically be extracted and must appear as labels in the plots. THIS SHOULD NOT BE DONE MANUALLY
2.Compatability check
- You code should exit gracefully, if a non-compatible file is provided as an input. It should say something like "File not recognized. Please provide a valid CONVERGE output file"
3.Basic performance calculation
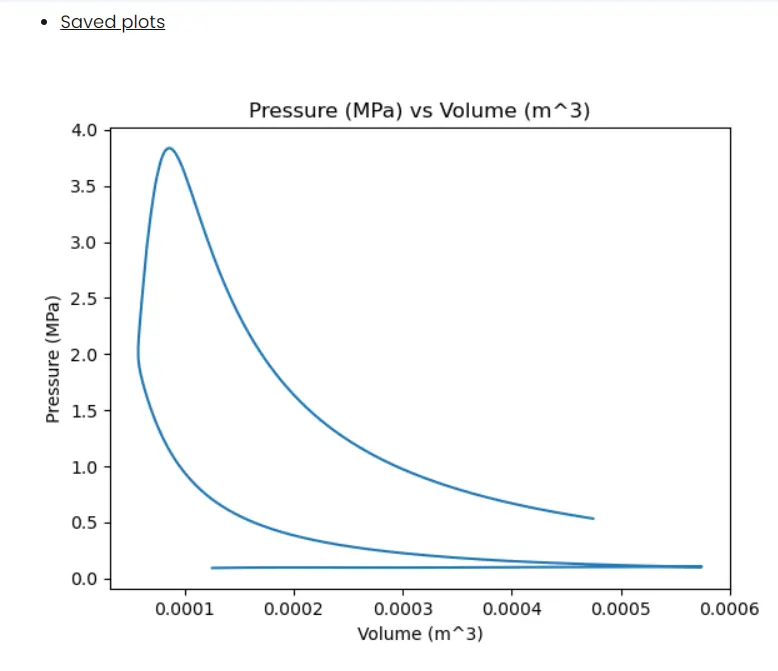
- Calculate the area under the P-V diagram. P is in column 2 and V is in column 8.
- Calculate the power output of this engine. Assume that RPM is 1500
- This engine consumed 20 micro grams of fuel (per 1 stroke cycle). Calculate its specific fuel consumption.
THEORY -
Thermodynamic data collected from simulation of a port fuel injected engine is extracted and analyzed from a data file using a Python program. This data f ile consists of 17 columns of different thermodynamic properties for which more than 8000 values have been recorded.
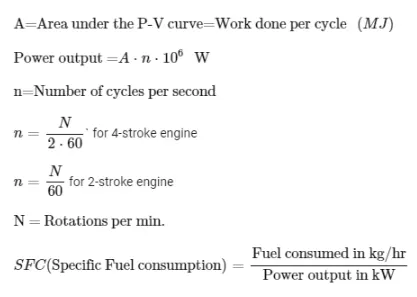
From the data file we can understand that it a 4-Stroke otto cycle. So,we will apply the following formula for to calculate the work done,Power output and Specif ic fuel consumption -
Python code -
#DATA ANALYSIS OF ENGINE DATA

#Importing the modules
import numpy as np
import matplotlib.pyplot as plt
from scipy.integrate import simps


filename = input ("Enter the name of CONVERGE output filename with extension (.out):")

#COMPATIBILITY CHECK

#Checking if the file is a valid CONVERGE output file try :
        f = open(filename)
        f.close()
except FileNotfoundError:
        print('File not recognized. Please provide a valid CONVERGE output file')
        exit()

#Checking if data is present in the CONVERGE output file
i=0
for line in open(filename):
        if '#' not in line:
             break
        i = i+1

j=0
for line in open(filename):
        j=j+1
        if j>i :
                break

if j==i:
        print('No data present in the CONVERGE output file')
        exit()
#DATA  EXTRACTIOf

i=0
for line in open(filename):
        if i==2:
                c = line.split()#Storing unit of variables in list c
                i=0
                break

        if i==1:
                b=line.split() #Storing names of variables in list b
                i = i+1

        if 'column' in line .split():
                a = line .split () #Storing column numbers of variables in list a
                i=1


a.remove("column") #Removing column f rom list a
a.remove("#")  #Removing # from list a
a = np.array(a,dtype=np.int) #Converting data to integer
b.remove("#")#Removing ii from list b
c.remove("#") #Removing # from list c
num_col = len(a) #Number of columns/ number of variables


#GETTING THE  DATA


data_counter = 0 #Initializing number of data points counter variable
data = np.arange(0,num_col)

for line in open(filename):
        if '#' not in line:
                d = line.split()#Storing current data line as in d
                d = np .array(d,dtype=np.float32)#Converting list data to float array
                data = np.vstack ([data,d])#Stacking the float array d in data matrix
                data_counter = data_counter + 1

data=np.delete( data,0, 0) #Deleting the f irst row used to initialize the array


#DATA  VISUALIZER

print (' Type -' )

for i in a:
        print (' {} for {}' .format ( i,b[i-1]) )


print (' ')
x =  input("Do you want a plot between any two variables ?  ( y/n) : ")


while(x.lower()== ' y ' ):
        cn1 = input ("Enter the clumn number of the variable along X-axis( Refer input map above) :")
        cn2 = input("Enter the clumn number of the variable along Y-axis (Refer input map  above) :")
        cn1  =  int ( cn1)
        cn2 = int ( cn2)
        plt.figure ()
        plt.plot (data[ :,cnl -1],data[ :,cn2-2] )
        plt.xlabel('{} {}'  .format( b [cn1-1],c[cn1-1]))
        plt.ylabel('{} {}' .format(b[cn2-1],c[cn2- 1]))
        plt.title( ' {} {} vs {} {}'  .format(b[cn2- 1],c[cn2 -1],b [cn1-1],c[cn1-1))
        z = "n"
        z  =  input ( "Do you want  to save the plot?  (y/n) :")
        if (z.lower()== 'y'):
            plt.savefig("{}-{}.png".format(b [cn2-1],b[ cn1-1]))
            plt.show()
            print( '  ' )
            x =  input("Do you want plot any  other two variables (y/n) : ")
print(' ')
x =  input ( "Do you want a single variable plot ?  (y/n) :")
while(x.lower()== ' y '):
    cn = input ("Enter the column number of  the variable  ( Refer  input map above) : ")
    cn  =  int (cn)
    plt .figure()
    plt.plot (np.arange(0,data_counter) ,data[:,cn-1])
    plt.xlabel( 'Data point number')
    plt.ylabel( '{} {} ' .format( b [cn-1],c[cn- 1]))
    plt.show()
    print( '  ' )
    x = input ( "Do you want any othe1·single variable plot?  (y/n) : ")
print ('   ')
#CALCULATIONS

print ( ' PERFORMANCE OF THE ENGINE ')

#Work done
b1 =  [i.lower()  for  i in b]
pressure_column = b1.index('pressure ')
volume_column   = b1 .index( 'volume ')
pressure = data [:,pressure_column ]
volume = data[:,volume_column]
A = 0 #Area under the P-V curve
A = simps(pressure,volume,even= ' first ')*np.power( 10,6) #Work per cycle(J)

#Power  output
rpm =  float(input('Enter the rpm of  the engine at which  data was collected ;  ')) #Rotation  per min
f = float(input ( ' Enter the value of  the fuel consumed per cycle (in micrograms ) : ')) #Fuel consumpt ion per cycle
n  = rpm/ ( 2*60) #Number of cycle per second for 4-stroke engine
P = A*n  #Power output (l) at speed N  (rad/s)

#Specific fuel consumption
f = (f*n*3600) /np .power(10,9) #Fuel consumpt ion ( Kg/hr)
sfc =  ( f *1000)/P	#Specif ic fuel consumpt ion (Kg/hr .Kl;)

#Results
print ('Area under  the P-V curve( i.e. the Work done per cycle)={} J ' .format (A))
print (' Power output  at  {} rpm  =  {} W' .format(rpm,P))
print ('Specific fuel consumpt ion =  {} Kg/KW .hr ' .format(sfc) )
EXPLANATION OF PYTHON CODE -
- Import the necessory modules.
- Take filename as an input and assign to 'filename'variable.
- Perform compatibility test
- Checking if the file is a valid CONVERGE output file
- Checking if data is present in the CONVERGE output file
Data extraction -
Extracting data along withthe column nc1me and column number from the CONVERGE output file.Complete data from the file stored in two 2D array 'data'.The columns of the data matrix contains the data for each individual parameters.
Getting the data -
- Provide an instruction to the user so that he/she can use the numbers as an input to designate the variables to be plotted.
- Ask users of plot between any two variables is required.If input is 'y' then ask for the numbers representing the
variables to be plotted. - Ask the user if the plot is to be saved or not.
- Then show the plot.
Above steps runin a while loop untiluser gives an input 'n' to the question "Do you want a plot between any two variables? (y/n):"
Calculation -
- Extract volume and pressure data from matrix 'data' and store in the 'volume'and 'pressure' respectively.Then, Numerically integrate pressure and volume data using simps() function from scipy.integrate library. It is the work done by the engine.
- Take the value of engine speed (in rpm) and fuel consumption (in microgram) form user. Calculate the Power
produced and Specific fuelconsumption using the derived formulas.
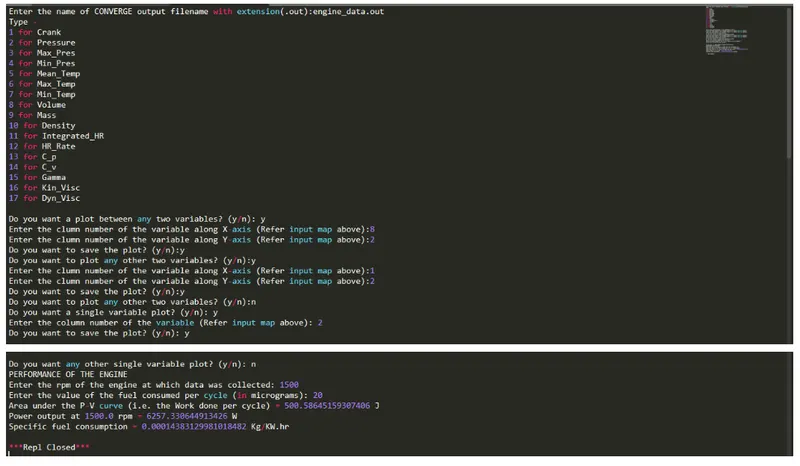
RESULTS -