Week 6 - Data analysis
Aim:- To Write a python script that does data analysis.
Objectives:-
Ensuring
1. Data visualizer
2. Compatability check
3. Basic performance calculation
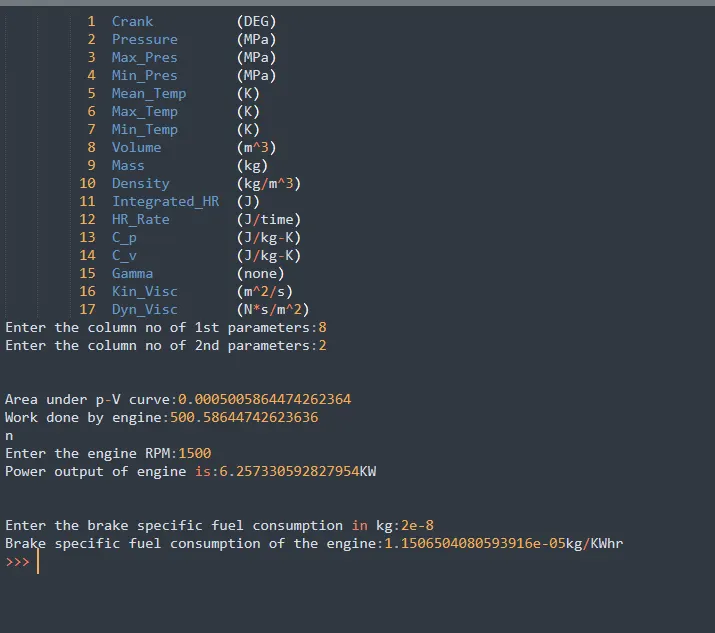
- Calculate the area under the P-V diagram. P is in column 2 and V is in column 8.
- Calculate the power output of this engine.
- Calculate specific fuel consumption.
Theory:-
Data analysis is a process of inspecting, cleansing, transforming, and modeling data with the goal of discovering useful information, informing conclusions, and supporting decision-making. The purpose of Data Analysis is to extract useful information from data and taking the decision based upon the data analysis.
1. Data visualizer- Data visualization is the graphical representation of information and data. By using visual elements like charts, graphs, and maps, data visualization tools provide an accessible way to see and understand trends, outliers, and patterns in data.
2. Compatability check- Code should be exit gracefully, if a non-compatible file is provided as an input. It should say "File not recognized. Please provide a valid CONVERGE output file"
3. Basic performance calculation- Calculating the area under the P-V diagram by entering column numbers. Then calculating the power output of this engine by assuming RPM is 1500 and this engine consumed 20 micro grams of fuel (per 1 stroke cycle) and that calculate its specific fuel consumption.
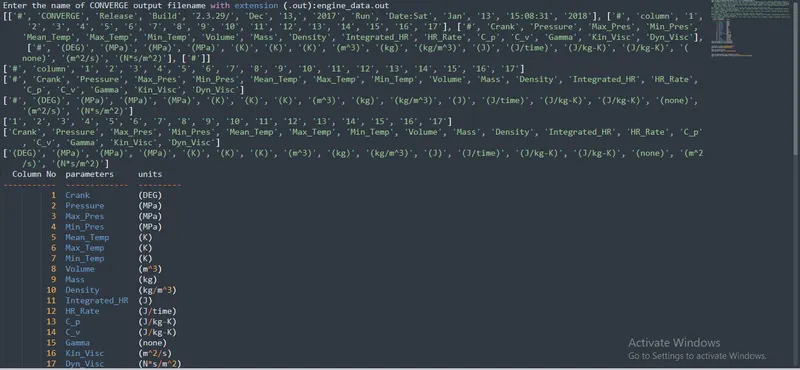
Input:- Inputing engine_data.out data file. This file including engine simulation output data and it has different parameters output as columns with defined column number and unit.
Program:-
# Data analysis by using python
#Importing modules
import math
import matplotlib.pyplot as plt
import numpy
from scipy.integrate import simps
from tabulate import tabulate

#compability check
# File input
File = input("Enter the name of CONVERGE output filename with extension (.out):")

#checking if the file is a valid CONVERGE output file
try:
	f = open(File)

except FileNotFoundError:
	print('File not recognized. Please provide a valid CONVERGE output file')

# To get titles of data file
titles = []
for line in open(File):
		if '#' in line:
			titles.append(line.split())
print(titles)
print(titles[1])
print(titles[2])
print(titles[3])

# To get column number from data file
S_num =[]
for sn in titles[1]:
	if '#' not in sn:
		if 'column' not in sn:
			S_num.append(sn)
print(S_num)

# To get the parameters name from data file
parameters = []
for p in titles[2]:
	if '#' not in p:
		parameters.append(p)
print(parameters)

# To get the units from data file
units = []
for u in titles[3]:
	if '#' not in u:
		units.append(u)
print(units)

# Printing parameters with units and column numbers
headers = ['Column No','parameters','units']
data = tuple(zip(S_num, parameters, units))
print(tabulate(data, headers))

# Plotting of parameters by knowing column numbers
a = int(input('Enter the column no of 1st parameters:'))
b = int(input('Enter the column no of 2nd parameters:'))
print('\n')

# To generate labels automatically for plots
x_l = parameters[a-1]
y_l = parameters[b-1]

# To store required value to plot
value_1 = []
value_2 =[]

# To calculate work done from p-V curve
pressure = []
volume = []

# Creating a loop to get required values from data file
for line in open(File):
	if '#' not in line:
		value_1.append(float(line.split()[a-1]))
		value_2.append(float(line.split()[b-1]))
		pressure.append(float(line.split()[1]))
		volume.append(float(line.split()[7]))

# To calculate area under p-V diagram
Area = simps(pressure,volume)
print('Area under p-V curve:' +str(Area))
print('Work done by engine:'+str(Area*1e6))
print('n')

# To calculate the power output of engine
rpm = int(input('Enter the engine RPM:'))
rps = rpm/60

# No of power strokes in revolution of crank shaft
power_strokes = rps/2

# Power in KW
power = (Area*1e6)*power_strokes/1000
print('Power output of engine is:'+str(power)+'KW')
print('\n')

# To calculate specific fuel consumption
r = float(input('Enter the brake specific fuel consumption in kg:'))
sfc = (r/power)*3600
print('Brake specific fuel consumption of the engine:'+str(sfc)+'kg/KWhr')

# To plot the variation parameters
plt.plot(value_1,value_2,linewidth=3)
plt.title(y_l+ "Vs" +x_l)
plt.xlabel(x_l)
plt.ylabel(y_l)
plt.grid()
plt.savefig('p-V plot')
plt.show()
Output:-
Plot:-
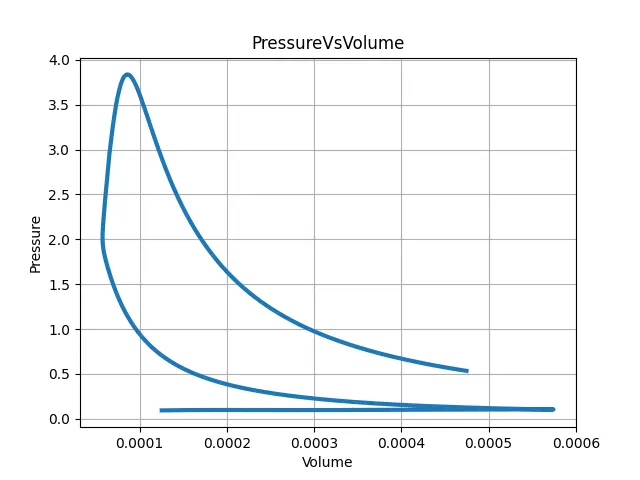
Conclusion:- Data analysis of engine_data.out was done by using python program and by entering any certain column numbers, it will create a plot with label of that columns.Results found satisfactory .