Week 6 - Data analysis
Aim: To write a script in python to do data analysis on the file provided by the name engine_data.out , open the file, segregate various portions of the file and plot the variations of one parameter w.r.t to another and all such things must happen in an automated manner.
Theory: Data analysis deals with the field of computational linguistics where it commonly defines the natural language processing. Natural language processing(NLP) is concerned with programming the computers to process and analyze the human written language. Parser helps to split large data into smaller data file and process the data.
Data analysis helps to automate certain things, reduces human effort and can be used for the applications of machine learning and automations.
Procedure:
1. Firstly, we're importing all the modules like math module,numpy module, matplotlib module, simps module from scipy library and tabulate module. simps module is being specifically used to calculate Area under the p-V diagram or the work done. tabulate module is used to create a table for column no,parameter names and parameter units.
2. Next, we go on to perform the compatibility check where we basically check if the file name entered by the user is valid and contains the file name which we enter. We're doing this when we're writing File=input("Enter the name of CONVERGE output filename with extension (.out):")- this is basically the file name input part where if we enter the file name as engine_data.out the code will proceed after that and if not it will print a statement saying 'File not recognized.Please provide a valid CONVERGE output file'. So, inputting the file name is happening first and then in the next stage we're using try and except commands to check if the file name entered is valid or not.
3. Now, after doing compatibility check, we go on to extract the header information of first five lines of the data file provided to us,containing #. This is primarily divided into four parts:
(i) In the first part, we're basically extracting the entire header information and storing in an empty array by the name titles=[]. We write> for line in open(File): if '#' in line: titles.append(line.split()). here, when the open command goes through each line of the filename engine_data.out, it checks if # is present in that line and if # is present then it simply stores all the information of that line into the titles array by using the append command. This is how we're extracting the entire header info into the titles array.
(ii) In the next part, we're extracting the column no from the data file which we have. For this, we're firstly taking an empty array by the name s_num which stores all the column nos. We're writing for sn in titles[1]:if '#' not in sn: if 'column' not in sn: , then we're appending the sn value which contains the values of titles index 1 one-by-one into the s_num array storing the column nos. When we're writing if # not in sn or if column not in sn, we're trying to check if # and column symbols or words are present in that line and trying to segregate them while appending into the s_num array as we do not need the # and column from that particular line. This separation or removal we're doing using if '#' not in sn: or if 'column' not in sn: commands from titles[1] or from 1st index of title array we're removing # and column and just keeping the column no intact.
(iii) In the next part, we're extracting the parameter names from the data file which we have. For this, we're firstly taking an empty array by the name parameters which stores all the parameter names. We're writing for p in titles[2]:if '#' not in p: , then we're appending the p value which contains the values of titles index 2 one-by-one into the parameter array storing the parameter names. When we're writing if # not in p , we're trying to check if # is present in that line or not and trying to segregate that while appending into the parameters array as we do not need the # from that particular line. This separation or removal we're doing using if '#' not in p: command from titles[2] or from 2nd index of title array we're removing # and just keeping the parameter names intact.
(iv) Similarly , we're doing the same for unit extraction as done in points (ii) and (iv). Here, we're extracting unit information about different parameters and storing in an empty array by the name units. Then , we're removing the # symbol by writing if '#' not in u: where u stores all the values of titles[3] array. After removal of # from that line, we simply append all other info about units into the units array.
4. Finally, whatever information we have gathered as described from 3 (i),(ii),(iii) and (iv), we represent them in the form of tables using tuple and tabulate commands.
5. Now, since we want to generate the plots automatically by simply knowing the column nos , so take two inputs using the input function. a=int(input('Enter column no of 1st parameter:')) implies that we're basically entering the column no of the 1st input which is the x-axis input. Similarly, we're doing the same for taking the y-axis input through column no and storing in b. print('\n') transfers the execution to next line by keep a line in space in between after taking both inputs.
6. We're then defining x_l = parameters[a-1] and y_l=parameters[b-1]. Here, we're writing this to be able to generate the labels of plots through automation be it where a and b inputs of column nos we take. Column no starts from 1 and goes to 17,however indexing in python begins from 0 and will go upto 16 in this case. Hence, we're mentioning x_l=paramters[a-1] i.e whatever column no - 1 will give us the index of that particluar parameters array column.
7. Now, we go on to define two empty arrays value_1 and value_2. These two arrays will be used to store all the values of the specific column no which we provide for a and b inputs.
8. We take an empty array of pressure when we write pressure=[] and also take an empty array of volume whenw write volume=[]. We're defining these two arrays so that we can calculate the area which we have been asked to calculate i.e. Area under the p-v plot or diagram. simps module basically helps us to calculate the area under p-v plot.
9. Before calculation of Area under p-v plot or the work done by the engine, we extract all the values of data file into the value_1 array, value_2 array,pressure array and volume array by running a for loop line-by-line using open(File)command and then append all the necessary values into respective arrays.
10. We are to calculate performance paramters as well like power output of the engine and specific fuel consumption of the engine. For calculation of power output of engine, we need to consider the engine rpm. We're taking an input for entering the rpm of the engine which is taken as 1500. rpm is the revolutions per minute and so, when we calculate revolutions per second (rps), therefore rps=rpm/60. Number of power strokes in 1 revolution of crank shaft will be given by rps/2 which is stored in the variable power_strokes. Now, the power output of the engine is calculated when we're writing power=(Area*1e6)*power_strokes/1000 and this equation gives us the power output of engine in kW. Then, we're just printing the same using print command.
11. Now, we go on to calculate the brake specific fuel consumption of the engine. Brake specific fuel consumption is basically defined as the amount of fuel which is consumed by engine in 'kg' to produce 1 kW of power in 1 hr. We take an input in variable r where we ask the user to enter fuel consumption per in kg. After considering the input, we know that bsfc=(r/power)*3600 where bsfc is the brake specific fuel consumption variable , r is the input for specific fuel consumption in kg, power is the engine output power and for consistency in units and get the bsfc in kg/kW-hr we're having the *3600 in the above equation. Finally, we're just printing the bsfc value using print command.
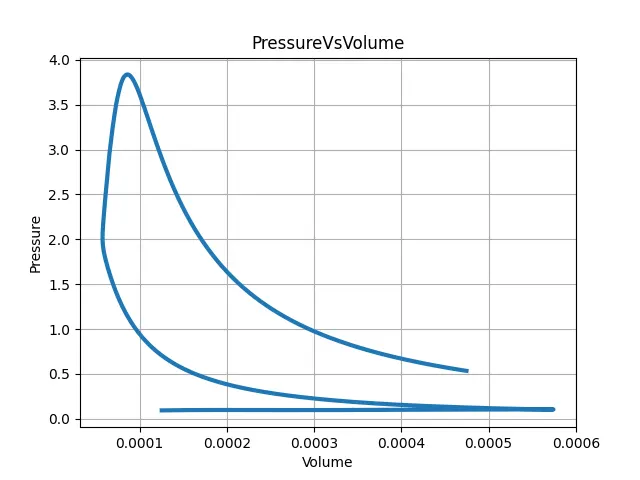
12. This the last part where do the plotting for variation parameters. plt.plot(value_1,value_2) gives the x-axis and y-axis parameters for which we're looking to plot , which depends upon the a and b inputs which we have taken for column nos. plt.title(x_l + "Vs" +y_l) gives the suitable title to plots automatically where x_l and y_l are again depending upon a and b inputs and parameters array. For x-label and y-label, we're providing the plt.xlabel and plt.ylabel commands. plt. grid() and plt.show() are finally used to create a grid and display the plots to us respectively.
The entire script is pasted below for reference and all the necessary automations has been done:
import numpy as np
import math as M
import matplotlib.pyplot as plt
from scipy.integrate import simps
from tabulate import tabulate

#File input and compatibility check
File=input("Enter the name of CONVERGE output filename with extension (.out):")

#Checking if the file is a valid converge output file
try:
    f=open(File)

except FileNotFoundError:
    print('File not recognized. Please provide a valid CONVERGE output file')

#To get titles of data file

titles=[]
for line in open(File):
    if '#' in line:
        titles.append(line.split())

print(titles)

#To get column no from data file
s_num=[]
for sn in titles[1]:
    if '#' not in sn:
        if 'column' not in sn:
            s_num.append(sn)

print(s_num)

#To get parameter names from data file
parameters=[]
for p in titles[2]:
    if '#' not in p:
        parameters.append(p)
print(parameters)

#To get units from the data file
units=[]
for u in titles[3]:
    if '#' not in u:
        units.append(u)
print(units)

#Printing parameters with units and column no
headers=['Column no','Parameters','Units']
data=tuple(zip(s_num,parameters,units))
print(tabulate(data,headers=headers))

#Plotting of parameters by knowing column no
a=int(input('Enter column no of 1st parameter:'))
b=int(input('Enter column no of 2nd parameter:'))
print('\n')

#To generate labels automatically for plots
x_l=parameters[a-1]
y_l=parameters[b-1]

#To store required value to plot
value_1=[]
value_2=[]

#To calculate work done from p-V curve
pressure=[]
volume=[]

#Creating a loop to get required values from data file
for line in open(File):
    if '#' not in line:
        value_1.append(float(line.split()[a-1]))
        value_2.append(float(line.split()[b-1]))
        pressure.append(float(line.split()[1]))
        volume.append(float(line.split()[7]))


#To calculate area under p-V diagram
Area=simps(pressure,volume)
print('Area under p-V curve:' +str(Area)+'MN-m')
print('Work done by engine:' +str(Area*1e6)+  'N-m or Joule')
print('\n')

#To calculate power output of the engine
rpm=int(input('Enter the engine RPM :'))
rps=rpm/60
power_strokes=rps/2 #No. of power strokes in 1 revolution of crank-shaft
power= (Area*1e6)*power_strokes/1000 #Output power in kW
print('Power output of engine is:'+str(power)+ "kW")
print('\n')

#To calculate specific fuel consumption
r=float(input('Enter specific fuel consumption per in kg:'))
bsfc=(r/power)*3600
print('Brake specific fuel consumption of the engine:'+str(bsfc)+  'kg/kWhr')

#To plot the variation parameters
plt.plot(value_1,value_2,linewidth=3)
plt.title(y_l+  "Vs" +x_l)
plt.xlabel(x_l)
plt.ylabel(y_l)
plt.grid()
plt.savefig('p-V diagram')
plt.show()
Plot-1 for reference :
Peformance calculations:
1. Area under p-V diagram = 0.005005864474262364 MN-m or work done by engine = 500.58644742623636 N-m or J.
2. Power output of engine when rpm=1500 is given by : 6.25733 kW.
3. Specific fuel consumption of the engine when 20 micrograms of fuel is consumed is given by : 1.15065 kg/kW-hr. 20 micrograms=2e-8 kg or 2x10^-8 kg. So, when we enter the fuel consumedin kg, we give it as : 2e-8 as we're suppose to mention that in kg.
Note: While entering filename please enter engine_data.out and not simply engine_data.