Week 6 - Data analysis
Data analysis
AIM:
To perform data analysis by importing raw data values from a data file into python and using those values to obtain useful and meaningful plots.
PROBLEM AND THEORY:
In simple words, data analysis is the process of collecting and organizing data in order to draw helpful conclusions from it. The process of data analysis uses analytical and logical reasoning to gain information from the data.
The main purpose of data analysis is to find meaning in data so that the derived knowledge can be used to make informed decisions.
In this program, we import data from a data file according to the wish of the user and then visualize it by plotting with the values.
STEPWISE EXPLANATION:
- - First, we import the necessary modules required for our program. Then we use the try and except commands to prepare the script for both the possibilities of availability and non-availability of the file and use appropriate display messages according to the resulting action.
- - After the file is opened using the open command, we set a counter to easily navigate through the lines of the file and skip the unnecessary comment files.
- - We print out a display menu containing the codes for all the available parameters in the data file and let the user choose the number.
- - We take input from the user using the input command along with a message, informing him to choose only numbers between 1 and 17 while picking the first and second parameters by inputting the corresponding number code.
- - Then, we convert the input from the user into a number by using the int command as the input is in the form of a string and successively, store the value of the numbers.
- - Then, we create a for loop, to access the data values of the column that the user had chosen and store them in empty variables created before the for a loop.
- - The counter is very helpful in navigating the lines of the file.
- - Then, we find the required engine parameter values ie, for the area under the curve, using the function traps. Similarly, other parameters were also calculated and then displayed using the appropriate units.
- - Finally, we plot the given data values by plotting the two variable arrays that contain the concerned column values.
- - To plot the label, we simply access the column headings in the data file and store the column heading in a separate variable and then print that variable as the label.
import math
import matplotlib.pyplot as plt
from scipy.integrate import simps

try:
   file= open('engine_data.out')
   print('file opened successfully n')
except:
    print('File not recognized. Please provide a valid CONVERGE output file.n')


# creating a counter to navigate which files we need to skip
ct = 1


print('The available plot paramters are as follows n')
print('1-crank,2-Pressure, 3-Max_Pressure, 4-Min_Pressure, 5-Mean_Temp, 6-Max_Temp, 7-Min_Temp, 8-Volume, 9-Mass,10-density, 11-integrated_HR, 12-HR_Rate, 13-C_p, 14-C_v, 15-Gamma, 16-kin-Vics, 17-Dyn_Visc')

# taking inputs from the user to select the parameters to be plotted
parameter_1 = input('Enter the first parameter to be plotted (between 1 and 17:')
parameter_2 = input('Enter the second parameter to be plotted (between 1 and 17):n')

# converting the given input data into integer
first_column = int(parameter_1)
second_column = int(parameter_2)

# storing the values from the given data file into variables using a for loop
first_parameter = []
second_parameter = []

for line in open('engine_data.out'):
    if ct is 3:
        column_1 = line.split()[first_column]
        column_2 = line.split()[second_column]
    if '#' not in line:
        first_parameter.append(float(line.split()[first_column-1]))
        second_parameter.append(float(line.split()[second_column-1]))

    ct+=1
# area under curve(work done)
Area = float(simps(first_parameter, second_parameter))
print(Area)

# power output
rpm = 1500
speed = rpm/60
power = area*speed
print(' Power Output of the Engine is: ' , Power , 'kW')


# bsfc
m_f = 20*pow(10,-6)
bsfc = (m_f*3600)/power
print('Specific Fuel Consumption:',bsfc,'gm/KWhr')

#plotting
plt.plot(first_parameter,second_parameter)
plt.xlabel(column_1)
plt.ylabel(column_2)
plt.show()
RESULTS:

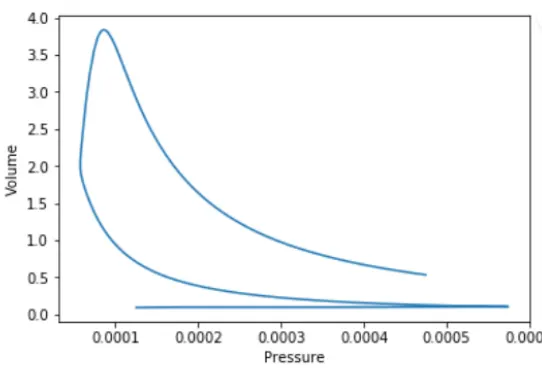
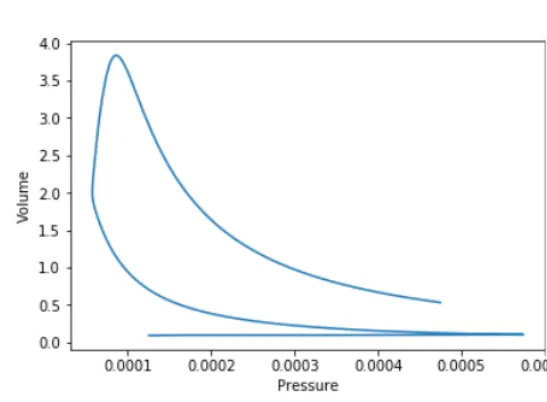
Hence, from the above program, the required data was imported from the data file and the required plots could be visualized from it.