Week 6 - Data analysis
Data analysis process
As the data available to companies continues to grow both in amount and complexity, so too does the need for an effective and efficient process by which to harness the value of that data. The data analysis process typically moves through several iterative phases. Let’s take a closer look at each.
-
Identify the business question you’d like to answer. What problem is the company trying to solve? What do you need to measure, and how will you measure it?
-
Collect the raw data sets you’ll need to help you answer the identified question. Data collection might come from internal sources, like a company’s client relationship management (CRM) software, or from secondary sources, like government records or social media application programming interfaces (APIs).
-
Clean the data to prepare it for analysis. This often involves purging duplicate and anomalous data, reconciling inconsistencies, standardizing data structure and format, and dealing with white spaces and other syntax errors.
-
Analyze the data. By manipulating the data using various data analysis techniques and tools, you can begin to find trends, correlations, outliers, and variations that tell a story. During this stage, you might use data mining to discover patterns within databases or data visualization software to help transform data into an easy-to-understand graphical format.
-
Interpret the results of your analysis to see how well the data answered your original question. What recommendations can you make based on the data? What are the limitations to your conclusions?
CODE EXECUTION
import math
import matplotlib.pyplot as plt
import numpy as np
# File validity check
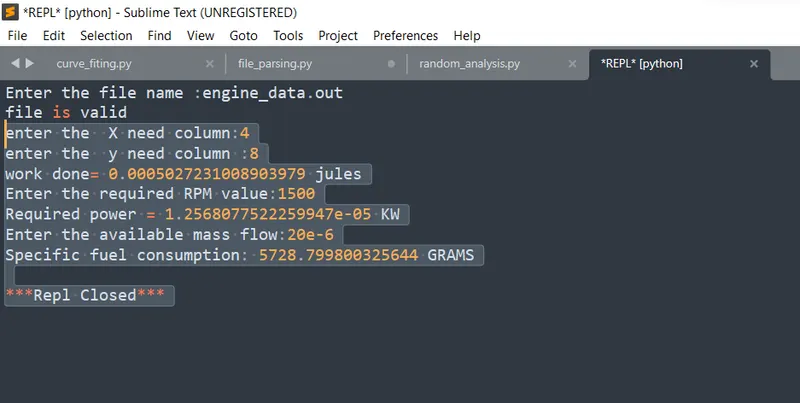
file_name = input("Enter the file name :")
if file_name == "engine_data.out":
print ("file is valid" )
else:
print ("file does not valid")
#required data
DATA_X= int(input('enter the X need column:')) -1
DATA_Y= int(input('enter the y need column :')) -1
File=[]
minimum_presure=[]
volume =[]
for line in open(file_name):
if '#' not in line:
minimum_presure.append(float(line.split()[DATA_X]))
volume.append(float(line.split()[DATA_Y]))
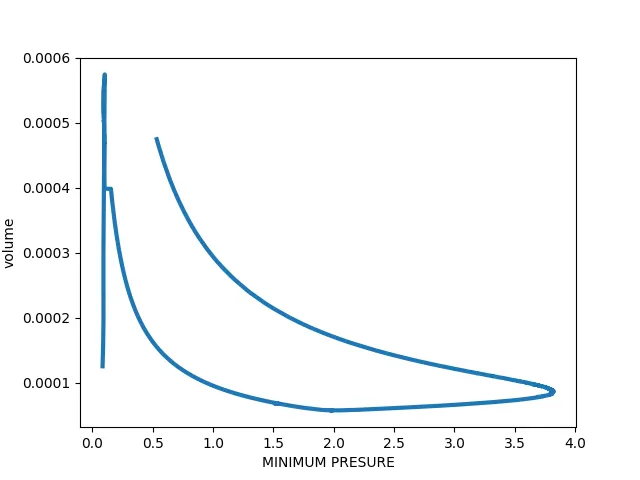
plt.plot(minimum_presure,volume,linewidth=3)
plt.xlabel("MINIMUM PRESURE")
plt.ylabel("volume")
plt.show()
# specific fuel consumption calculation
area= np.trapz(minimum_presure,volume)
print("work done=",area,"jules")
rpm =int(input('Enter the required RPM value:'))
Cycle_per_second=rpm/60
POWER = area*Cycle_per_second/1000
print("Required power =", POWER, "KW")
mass_flow=float(input("Enter the available mass flow:"))
SFC=mass_flow*3600/POWER
print("Specific fuel consumption:",SFC,"GRAMS")
PRESURE AND VOLUME RELATION PROBlEM
FUEL CONSUMPTION CALCULATION
The Specific Fuel Consumption
The specific fuel consumption correlates the fuel consumed to the work output.
In contrast to the previous fuel consumption values, it is not the fuel volume that is used, but the fuel mass.
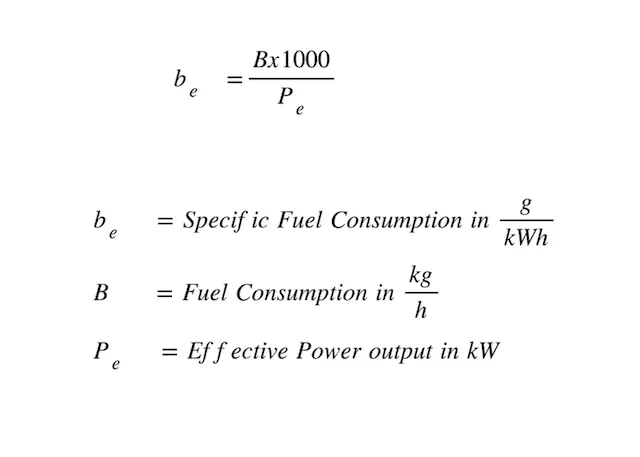
The unit of measurement is g/kWh.
The measurement is usually carried out on an engine test bench, so the calculation is based on the measured power output. Since the fuel mass is related to time, the power becomes the mechanical work in this case.
This value characterizes the efficiency of the motor.
By using the fuel mass, the influence of changes in the density of the liquid is excluded. The fuel mass represents directly the chemical energy contained in the diesel fuel. Therefore, it is energy input versus work output, and this is the definition of efficiency.
This value is the hot topic of conversation among engine developers and thermodynamicists. This is where they live out their ambition.
Usually, the specific fuel consumption is not communicated as a single value, but as a diagram with multiple values for different operating points of the engine.
The lines, giving it the shell look, represent lines of the same specific fuel consumption. (The pressure value on the y-axis correlates with the engine torque. Don’t be confused. It’s the small p for pressure, not the capital P for power.)
The specific fuel consumption map of an engine is a very important information for engineering smart driving and engine control strategies. Therefore, it is used very frequently by the engineers of the vehicle manufacturer. In daily operation, it is not so commonly used.