Week 6 - Data analysis
TASK: DATA ANALYSIS:
OBJECTIVE:
To write a python program which takes in CONVERGE output files and analyses the data and helps representing it in simpler manner by fulfilling visualization, compatibility criteria and performs simple performance calculations with user inputs.
PROBLEM STATEMENT:
- Firstly, using ‘for’ loop, and ‘open(‘’)’ command, the file is read line by line. But to make sure the file is input by the user, instead of ‘input(‘’)’ prompt user can directly enter their requirement in program input itself. To make sure the input file is compatible with the code the prompt is kept informative. In order for the code to exit gracefully, ‘try:.....except:..’ loop format was used such that, the code runs the ‘try’ loop if the file is compatible, otherwise it skips to ‘except’ loop where a informative command is printed to make user know the possible error.
- Now to store all the data in the file ‘for’ loops are used. As mentioned, we can only read the data line by line, hence to store the data column wise, ‘line.split()’ command is used to isolate each parameter in its line. Now, this split parameters are stored as a string in array using ‘append’ operation, such that, every ‘nth ’ parameter in all the lines is appended into the same array. This way, all the column parameters are stored in separate arrays.
- To make things easy when calling for a certain column parameters, the same method is used to store the column numbers, names and units in separate arrays as ‘strings’ instead of ‘float’s or ‘int’egers. Further the ‘strings’ from column number array are equated to the data array such that the column number ‘string’ is replaced by the data. This way by requesting the column number, all the data in that column can be accessed.
- Now to get a plot, the ‘input’ is used to request column numbers, these numbers are stored in 2 variables and again using the data arrays, these variables are co-related to respective columns and plotted using ‘matplotlib’ module. The arrays for column names and units were used in similar way to give labels and titles to these plots as well as unique filenames to save separately.
- Then,perform some basic calculations to show the power and specific fuel consumption.
SOLUTION PROCEDURE:
STEP 1: Begin the program with getting some inputs,instead of using input prompt I used x,y,z variables to get inputs of user.
- variable "z" denotes value either 1 (single plot) or 2(double plot)
- variable "x" denotes x axis parameter ex: for volume enter 8
- variable "y" denotes y axis parameter ex: for pressure enter 2
Step 2: Compatibility check done by try to open the file if it is not available then error should be displayed as output.
['File not recognized. Please provide a valid CONVERGE output file!']
Step 3: Data Visualizer is done by spliting each line by using loop function,then convert those column value as separate array in the column label itself.
Step 4: Plotting all the array by using loop function.
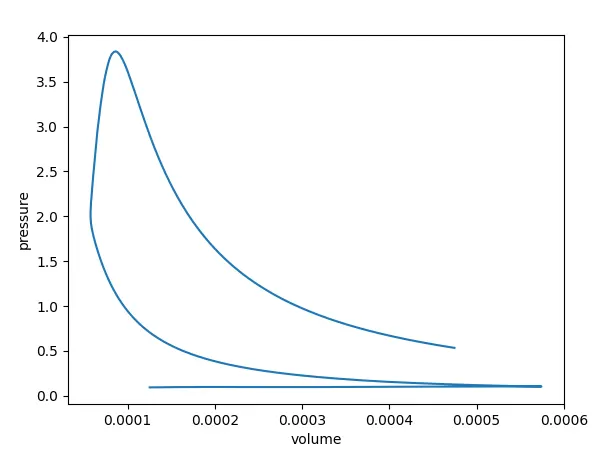
Step 5: Plotting done according to the user Input (x,y,z)
This can be done by taking z value, which denotes single plot or double plot.
Now using "If" Condition for chosing the plots and x,y values for x & y axis.
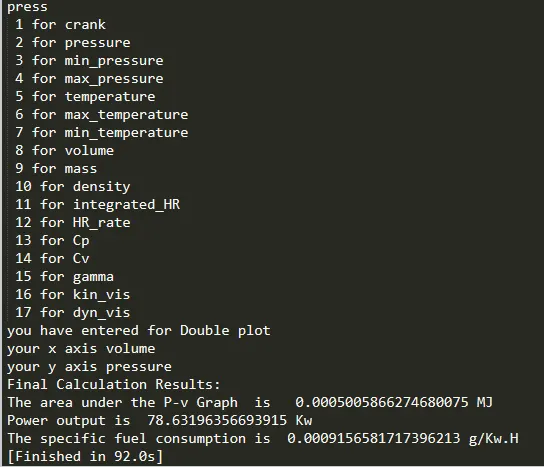
Step 6: Performing Basic Calculation to Find power and specific fuel consumption.
- rpm=1500
- area = np.trapz(c[2],c[8])
- workdone=area*1000
- power = 2*pi*rpm*workdone/60
- sfc = (20/1000000)*3600/power
Program Code:
import math
import matplotlib.pyplot as plt
import numpy as np
import sys


#User Inputs:
#input values to see output required output plot
#Kindly Type Your Plot: z denotes value either 1 (single plot) or 2(double plot)
z=2
# Kindly Enter your X value:x denotes x axis parameter ex: for volume enter 8
x=8
# # Kindly Enter your X value:y denotes y axis parameter ex: for pressure enter 2
y=2


# 1)compatability check
try:
  f=open('engine_data.out','r')
except FileNotFoundError:
  print('File not recognized. Please provide a valid CONVERGE output file!')
  sys.exit()


# 2) data visualizer
crank=[]
pressure=[]
min_pressure=[]
max_pressure=[]
temperature = []
max_temperature=[]
min_temperature=[]
volume = []
mass=[]
density=[]
integrated_HR=[]
HR_rate=[]
Cp=[]
Cv=[]
gamma=[]
kin_vis=[]
dyn_vis=[]
label=[]

line_count =1
for line in open('engine_data.out'):
	if '#' not in line:

		crank.append(float(line.split()[0]))
		pressure.append(float(line.split()[1]))
		min_pressure.append(float(line.split()[2]))
		max_pressure.append(float(line.split()[3]))
		temperature.append(float(line.split()[4]))
		max_temperature.append(float(line.split()[5]))
		min_temperature.append(float(line.split()[6]))
		volume.append(float(line.split()[7]))
		mass.append(float(line.split()[8]))
		density.append(float(line.split()[9]))
		integrated_HR.append(float(line.split()[10]))
		HR_rate.append(float(line.split()[11]))
		Cp.append(float(line.split()[12]))
		Cv.append(float(line.split()[13]))
		gamma.append(float(line.split()[14]))
		kin_vis.append(float(line.split()[15]))
		dyn_vis.append(float(line.split()[16]))


		line_count = line_count+1
c=np.array([[0],crank,pressure,min_pressure,max_pressure,temperature,max_temperature,min_temperature,volume,mass,density,integrated_HR,HR_rate,Cp,Cv,gamma,kin_vis,dyn_vis])
name = ['crank','pressure','min_pressure','max_pressure','temperature','max_temperature','min_temperature','volume','mass','density','integrated_HR','HR_rate','Cp','Cv','gamma','kin_vis','dyn_vis']

for h in range(1,18):
	plt.figure(h)
	plt.plot(c[h])
	plt.plot(name[h-1])
	plt.savefig(name[h-1]+'.png')
	plt.close()


print('press \n 1 for crank\n 2 for pressure\n 3 for min_pressure\n 4 for max_pressure\n 5 for temperature\n 6 for max_temperature\n 7 for min_temperature\n 8 for volume\n 9 for mass\n 10 for density\n 11 for integrated_HR\n 12 for HR_rate\n 13 for Cp\n 14 for Cv\n 15 for gamma\n 16 for kin_vis\n 17 for dyn_vis')

if z==1:
	print('you have entered for single plot')
	print('your x axis '+name[x-1])
	plt.figure()
	plt.plot(c[x])
	plt.ylabel(name[x-1])
	plt.show()
if z==2:

	print('you have entered for Double plot')
	print('your x axis '+name[x-1])
	print('your y axis '+name[y-1])
	plt.figure()
	plt.plot(c[x],c[y])
	plt.xlabel(name[x-1])
	plt.ylabel(name[y-1])
	plt.show()


# 3) Baic Performance Calculation

print('Final Calculation Results:')
rpm=1500
area = np.trapz(c[2],c[8])
print('The area under the P-v Graph  is  ',area,'MJ')
workdone=area*1000
power = 2*math.pi*rpm*workdone/60
print('Power output is ',power,'Kw')

sfc = (20/1000000)*3600/power
print('The specific fuel consumption is ',sfc,'g/Kw.H')
RESULTS AND OUTPUT:
P-v Diagram:
OUTPUT OF CALCULATION:
OUTPUT OF COMPATABILITY CHECK:

CONCLUSION:
Thus,The program can be used simply to visualize the overwhelming amount of data a simulation program produces in ‘.out ’ file for the better understanding of it. Similar program can be used as a post processor for such a simulation involving animations and further visualization tools. Also Checks Compatibility if file not found,ans Also do some Basic Calculations.