Challenge

Project - Traveling salesman problem

PROJECT1:

% Creating X co ordinates By Using Rand Function:

x=randi(100,1,20);

x


x =

36 84 59 55 92 29 76 76 39 57 8 6 54 78 94 13 57 47 2 34

% Creating Y co ordinates By Using Rand Function:

y=randi(100,1,20);

y


y =

17 80 32 53 17 61 27 66 69 75 46 9 23 92 16 83 54 100 8 45

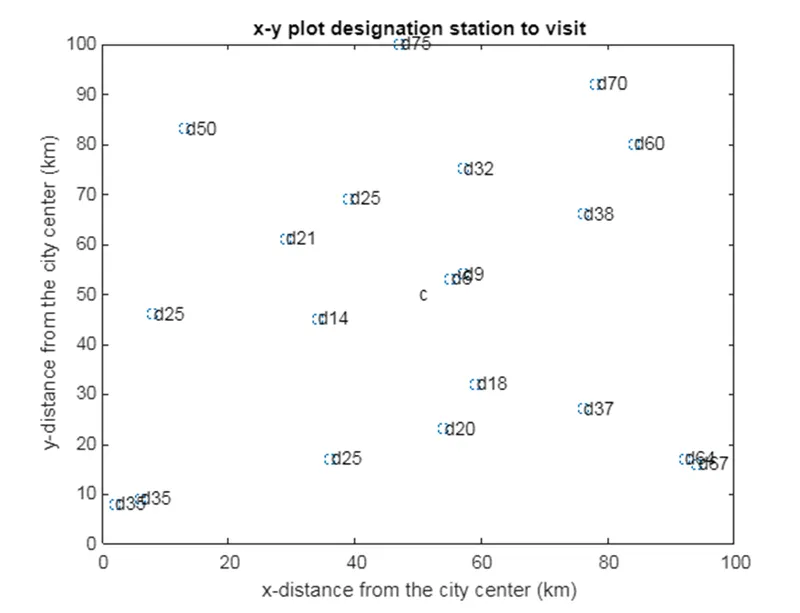
% Plotting & labelling The Graph as Required:

plot(x,y,'o');

xlabel('x-distance from the city center (km)');ylabel('y-distance from the city center (km)');

title('x-y plot designation station to visit');

% Finding The Center Of the Graph:

text(50,50,'c');

% Calculating The Distance of Each POint From Center And Plotting Into The Graph:

for i =1:20,

d(i)=round(sqrt(((50^2)-(x(i)^2))^2+((50^2)-(y(i)^2))^2)/100);

text(x(i),y(i),"d"+d(i));

end;
% Main Stream Function:

clc
clear all
close
p=20;
c=25;
tg=100;
fc=2;
lc=20;
Data= [x y];
[x y]=size(Data);
nc=x;
figure
title('min avg');
xlabel('generation')
ylabel('total timetravel')
hold on;
P=population(p,nc);
for i=1:tg;
P(p+1:p+c,:)=crossover(P,c);
P(p+c+1:p+c+m,:)=mutation(P,m);
E=evaluation(P,Data);
[P S]=selection[P,E,p];
Mean(i)=sum(s)/p;
Best(i)=S(1,1);
plot(Mean(:),'r.');drawnow
hold on;
plot(Best(:),'b.');drawnow
end;
min_total_distance = min(Best);
Optimal_solution=P(1,:)
[x1 y1]=size(Optimal_Solution);
figure
xlabel('X')
ylabel('Y')
hold on
plot(Data(:,2),Data(:,3),'^r','MarkerSize',10,'LineWidth',2)
for i=1:x
text(Data(i,2)+0.2,Data(i,3)+0.2,num2str(i)),'Fontsize',15);
end;
Data2=zeros(size(Data))
for i=1:y1
text(Data2(i,:))=Data(Optimal_solution(i),:);
end;
line(Data2(;,2),Data2(:,3),'Linestyle','-','linewidth',2);
Your portfolio, next

Ship work like this
in your own course.

Talk to a career counsellor

Free 20-minute call. We'll map the right course to where you want to work.

By submitting you agree to our Terms and Privacy Policy.

Talk to a career counsellor

Free 20-minute call. We'll map the right course to where you want to work.

By submitting you agree to our Terms and Privacy Policy.