Week 6 - Data analysis
Objective:
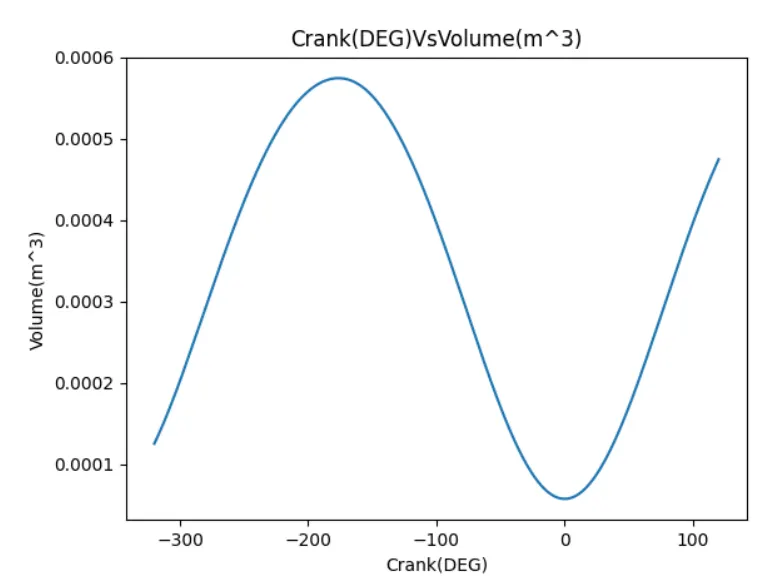
Extract a plot between any two quantities from the given data file automatically.
Compatibility check: Code should exit gracefully, if a non-compatible file is provided as an input.
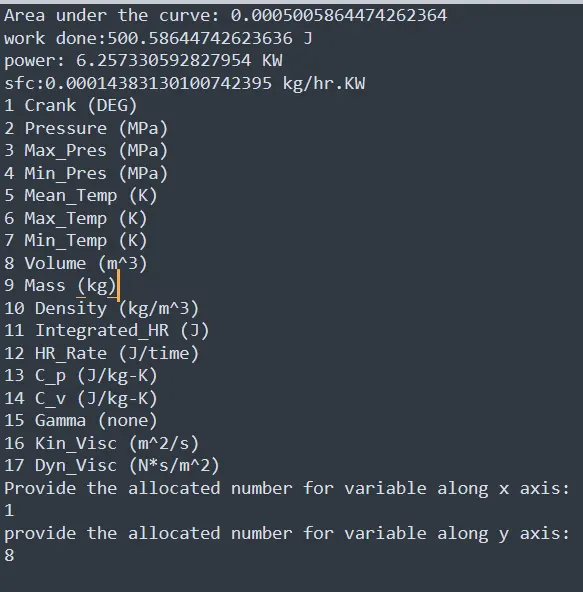
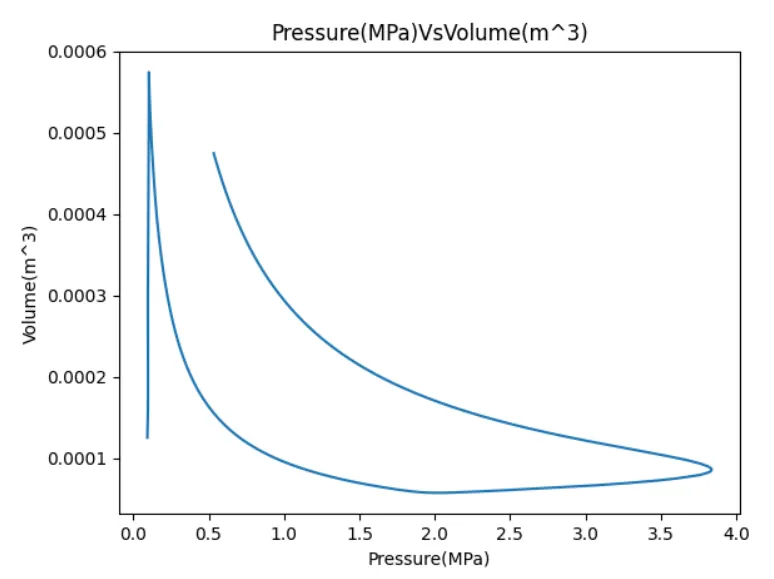
Calculate the area under P-V diagram.
Calculate the power output of an engine running at 1500 RPM.
Calculate the specific fuel consumption for an engine which consumes 20 micro grams of fuel (per 1 stroke cycle).
Governing Equations:
Power = Area * no.of cylinders * (stroke/1000)
Work done = Area under P-V diagram
Specific fuel consumption = Fuel consumption * stroke * (3600/power) * 1000
Python Code:
"""
Data Analysis by Giridhar
"""
import matplotlib.pyplot as plt
import math
import numpy as np
from scipy.integrate import simps as simps, trapz as trapz
# File compatibility check:
try:
     open('engine_data.out')
except:
     print('File not recognized. Please provide a valid CONVERGE output file')
# Reading the file
line_count = 1
Pressure = []
Volume = []
for line in open('engine_data.out'):
     if '#' not in line:
         values = line.split()
         Pressure.append(float(line.split()[1]))
         Volume.append(float(line.split()[7]))
         number_of_columns = len(values)
         line_count = line_count + 1
# Basic Performance calculation:
# Area under the P-V diagram:
area = simps(Pressure, Volume)
print('Area under the curve: ' +str(area))
area = area*1e6
print('work done:' +str(area) + ' J')
#Power Output
fuel_consumption = 20
n = 1
rpm = 1500
stroke_cycle = rpm/120
power = n*area*stroke_cycle/(1000)
print('power: ' +str(power) + ' KW')
sfc = (fuel_consumption*pow(10, -6)*stroke_cycle*3600)/(power*1000)
print('sfc:' +str(sfc) + ' kg/hr.KW')
# Extracting Parameters and units
ct = 1
for line in open('engine_data.out'):
     if ct == 3:
         parameter = line.split()
     if ct == 4:
         unit = line.split()
     ct = ct + 1
# Numbering
for i in range(1,18):
     print(i, parameter[i], unit[i])
print('Provide the allocated number for variable along x xis:')
x=int(input())
print('Provide the allocated number for variable along y axis:')
y=int(input())
X = []
Y = []
ct = 1
for line in open('engine_data.out'):
     if ct == 3:
         x_parameter = line.split()[x]
         y_parameter = line.split()[y]
     if ct == 4:
         x_axis = x_parameter + line.split()[x]
         y_axis = y_parameter + line.split()[y]
     if '#' not in line:
         X.append(float(line.split()[x-1]))
         Y.append(float(line.split()[y-1]))
     ct = ct + 1
# Plotting:
plt.plot(X,Y)
plt.xlabel(x_axis)
plt.ylabel(y_axis)
plt.title(x_axis+ 'Vs' +y_axis)
plt.savefig(x_axis+'Vs'+y_axis+'.png')
plt.show()