Week 6 - Data analysis
Aim: - Write a code that should take column numbers as the input and plot the respective columns as separate images.
- Each file should be saved by the name of the column.
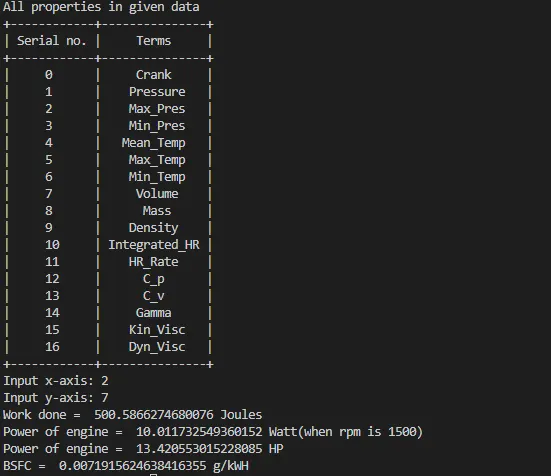
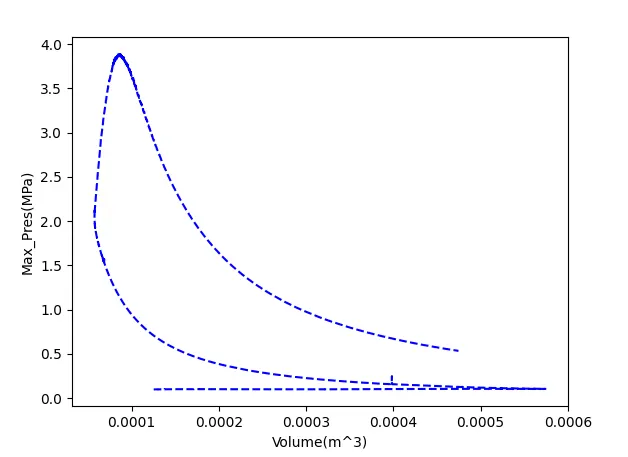
- Calculate the area under the PV diagram curve.
- Calculate the power output of this engine assuming rpm as 1500.
- This engine consumes 20 micrograms of fuel (per 1 stroke cycle). Calculate the specific fuel consumption.
Theory:
Data analysis is defined as a process of cleaning, transforming, and modelling data to discover useful information for business decision-making. The purpose of Data Analysis is to extract useful information from data and taking the decision based upon the data analysis
Why Data Analysis?
To grow your business even to grow in your life, sometimes all you need to do is Analysis!
If your business is not growing, then you have to look back and acknowledge your mistakes and make a plan again without repeating those mistakes. And even if your business is growing, then you have to look forward to making the business to grow more. All you need to do is analyze your business data and business processes.
Data Analysis Process
Data Analysis Process is nothing but gathering information by using proper application or tool which allows you to explore the data and find a pattern in it. Based on that, you can take decisions, or you can get ultimate conclusions.
Data Analysis consists of the following phases:
- Data Requirement Gathering
- Data Collection
- Data Cleaning
- Data Analysis
- Data Interpretation
- Data Visualization
Data Requirement Gathering
First of all, you have to think about why do you want to do this data analysis? All you need to find out the purpose or aim of doing the Analysis. You have to decide which type of data analysis you wanted to do! In this phase, you have to decide what to analyze and how to measure it, you have to understand why you are investigating and what measures you have to use to do this Analysis.
Data Collection
After requirement gathering, you will get a clear idea about what things you have to measure and what should be your findings. Now it's time to collect your data based on requirements. Once you collect your data, remember that the collected data must be processed or organized for Analysis. As you collected data from various sources, you must have to keep a log with a collection date and source of the data.
Data Cleaning
Now whatever data is collected may not be useful or irrelevant to your aim of Analysis, hence it should be cleaned. The data which is collected may contain duplicate records, white spaces or errors. The data should be cleaned and error-free. This phase must be done before Analysis because based on data cleaning, your output of Analysis will be closer to your expected outcome.
Data Analysis
Once the data is collected, cleaned, and processed, it is ready for Analysis. As you manipulate data, you may find you have the exact information you need, or you might need to collect more data. During this phase, you can use data analysis tools and software which will help you to understand, interpret, and derive conclusions based on the requirements.
Data Interpretation
After analyzing your data, it's finally time to interpret your results. You can choose the way to express or communicate your data analysis either you can use simply in words or maybe a table or chart. Then use the results of your data analysis process to decide your best course of action.
Data Visualization
Data visualization is very common in your day to day life; they often appear in the form of charts and graphs. In other words, data shown graphically so that it will be easier for the human brain to understand and process it. Data visualization often used to discover unknown facts and trends. By observing relationships and comparing datasets, you can find a way to find out meaningful information.
Formula used:
The power output of the engine:
`P_i = (imep*A_c*L*n*N)/(z*60)`
`P_i = (imep*(A_c*L)*n*N)/(z*60) = (imep *(V_c*n)*N)/(z*60)`
`P_i = (imep*V_e*N)/(z*60)`
where:
imep = indicated mean effective pressure (N/m^2)
`A_c` = cylinder area (m^2)
L = Stroke length (m)
n = number of cylinders
N = engine speed (rpm)
z = 1 (for 2 stroke engines), 2 (for 4 stroke engines)
`V_c` = swept volume of cylinder (m^3)
`V_e` = swept volume of engine (m^3)
Specific fuel consumption:
`SFC = (FC)/P_b`
where:
SFC = specific fuel consumption [(kg/h)/kW, kg/(3600 s x kW),kg/(3600kJ)]
FC = fuel consumption (kg/h)
`P_b` = brake power (kW)
CODE:
"""
Data Analysis in Python
"""

# Importing important libraries
import math
import matplotlib.pyplot as plt
from prettytable import PrettyTable
import numpy as np

#Input Parameters
crank = []
pressure = []
max_pressure = []
min_pressure = []
mean_temp = []
max_temp = []
min_temp = []
volume = []
mass = []
density = []
integrated_HR = []
HR_rate = []
Cp = []
Cv = []
gamma = []
kin_visc = []
dyn_visc = []

#Performing file parsing
for line in open('engine_data.out'):
	if '#' not in line:
		crank.append(float(line.split()[0]))
		pressure.append(float(line.split()[1]))
		max_pressure.append(float(line.split()[2]))
		min_pressure.append(float(line.split()[3]))
		mean_temp.append(float(line.split()[4]))
		max_temp.append(float(line.split()[5]))
		min_temp.append(float(line.split()[6]))
		volume.append(float(line.split()[7]))
		mass.append(float(line.split()[8]))
		density.append(float(line.split()[9]))
		integrated_HR.append(float(line.split()[10]))
		HR_rate.append(float(line.split()[11]))
		Cp.append(float(line.split()[12]))
		Cv.append(float(line.split()[13]))
		gamma.append(float(line.split()[14]))
		kin_visc.append(float(line.split()[15]))
		dyn_visc.append(float(line.split()[16]))

title = []
units = []

# Taking title from data provided
linecount = 1
for line in open('engine_data.out'):
	if linecount is 3:
		title.append(line.split())
	if linecount is 4:
		units.append(line.split())
	linecount+=1

t = [0,1,2,3,4,5,6,7,8,9,10,11,12,13,14,15,16]

print('All properties in given data')
table = PrettyTable(['Serial no.', 'Terms'])
for i in range(0,len(t)):
	table.add_row([t[i], title[0][i+1]])

print(table)

a = [crank, pressure, max_pressure, min_pressure, mean_temp, max_temp, min_temp, volume, mass, density, integrated_HR, HR_rate, Cp, Cv, gamma, kin_visc, dyn_visc]

x = int(input('Input x-axis: '))
y = int(input('Input y-axis: '))

plt.plot(a[x],a[y], 'r--')
plt.xlabel(title[0][x+1]+units[0][x+1])
plt.ylabel(title[0][y+1]+units[0][y+1])
plt.show()

pressure = np.array(pressure)*1e6
volume= np.array(volume)
area_under_pv = np.trapz(pressure,volume) #np.trapz integrates along given axis using trapezoidal rule and calculate the area under the curve
print('Work done = ', area_under_pv,'Joules')


#Power output
rpm = 1500
time_of_one_rev = rpm/60

onecycle = 2*time_of_one_rev
power = area_under_pv/onecycle
print('Power of engine = ',power,"Watt"'(when rpm is 1500)')
print('Power of engine = ', power/0.746, 'HP')

#Calculating Brake Specific Fuel Consumption
m = 20*pow(10,-6)
bsfc = (3600*m)/power
print('BSFC = ', bsfc, 'g/kWH')
Code explanation:
- Import basic modules math, matplotlib, prettytable and scipy
- Whenever we need to define more than one variable, we use an array and numpy.linspace does the task fro us in python.
- Use an empty array for storing values which we get from the for loop, t1 and t2 will store 10 values each.
- Next a for loop is generated and append command is used to continuously append the value of a variable. Each line was splitted using split() by , and empty space.
- Now empty arrays are created for title and units.
- Now under another for loop, title is taken from the engine_data.out file and linecount is used to count the iterations which are incremented on every pass.
- Next, we print the table using PrettyTable library which is designed to make it easy and quick to represent tabular data in aesthetically pleasing ASCII table, and then for loop is provided to generate a table.
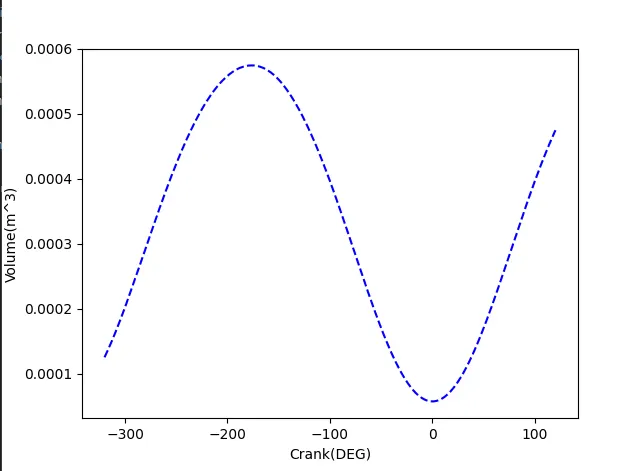
- Now, the plots are generated from the results obtained, as input by the user.
- All values of engine data are store in a column.
- The area under the PV curve is calculated using np.trapz(pressure, volume)
- Power is also calculated by providing the necessary formulas
- Lastly, BSFC calculated using the formula (fuel consumption per unit time/power output.
Output:
Command window:
Required crank vs volume diagram
PV Diagram Plot:
Results:
- Learnt how to manage a big chunk of data using python scripting.
- We have chosen to plot the PV diagram but any kind of plot can be obtained.