Project 1 - Parsing NASA thermodynamic data
1. Program to extract all 14 coefficients
a. Function for calculating the molecular weight
function [molecular_wt] = mw(species_name)
elements = ['H','C','N','O','A'];
atomic_wt = [1,12,14,16,40];
molecular_wt = 0;
for i = 1:length(species_name)
for j = 1:length(elements)
if strcmpi(species_name(i),elements(j))
molecular_wt = molecular_wt + atomic_wt(j);
position = j;
end
end
f = str2double(species_name(i));
if f>1
molecular_wt = molecular_wt + atomic_wt(position)*(f-1);
end
end
sprintf('The molecular weight of %s is %d', species_name, molecular_wt)
end
b. Function for calculating the thermodynamic properties
function [ c_p,H,S] = calculating_therm_properties(a1,a2,a3,a4,a5,a6,a7,a8,a9,a10,a11,a12,a13,a14,l_mid,T)
R = 8.314;
if (T>=l_mid)
c_p = R.*(a1+a2*T+a3*T.^2+a4*T.^3+a5*T.^4);
H = R.*T.*(a1+a2*(T/2)+a3*((T.^2)./3)+a4*((T.^3)./4)+a5*((T.^4)./5)+a6./T);
S = R.*(a1*log(T)+a2*T+a3*((T.^2)./2)+a4*((T.^3)./3)+a5*((T.^4)./4)+a7);
else
c_p = R.*(a8+a9*T+a10*T.^2+a11*T.^3+a12*T.^4);
H = R.*T.*(a8+a9*(T./2)+a10*((T.^2)./3)+a11*((T.^3)./4)+a12*((T.^4)./5)+(a13./T));
S = R.*(a8*log(T)+a9*T+a10*((T.^2)./2)+a11*((T.^3)./3)+a12*((T.^4)./4)+a14);
end
c. Main code for the program
close all
clc
% Opening the file and extracting the data
b = fopen('THERMO.dat','r');
q = fgetl(b);
A = strsplit(fgetl(b),' ');
% Extracting the global temperatures
global_low_temp = str2double(A{2});
global_mid_temp = str2double(A{3});
global_high_temp = str2double(A{4});
fgetl(b);
fgetl(b);
fgetl(b);
% Getting input from user
n = input('Enter the compound name: ','s');
while ~feof(b)
% Extracting the local temperatures
line1 = strsplit(fgetl(b),' ');
if strcmpi(line1,'END')==1
break
end
species_name = line1{1};
if (strcmpi(n,species_name)==1)
r=length(line1);
l_low = str2double(line1{r-3});
l_mid = str2double(line1{r-1});
l_high = str2double(line1{r-2});
% Extracting the coefficients
line2 = fgetl(b);
strposl2 = strfind(line2,'E');
a1 = str2double(line2(1:strposl2(1)+3));
a2 = str2double(line2(strposl2(1)+4:strposl2(2)+3));
a3 = str2double(line2(strposl2(2)+4:strposl2(3)+3));
a4 = str2double(line2(strposl2(3)+4:strposl2(4)+3));
a5 = str2double(line2(strposl2(4)+4:strposl2(5)+3));
line3 = fgetl(b);
strposl3 = strfind(line3,'E');
a6 = str2double(line3(1:strposl3(1)+3));
a7 = str2double(line3(strposl3(1)+4:strposl3(2)+3));
a8 = str2double(line3(strposl3(2)+4:strposl3(3)+3));
a9 = str2double(line3(strposl3(3)+4:strposl3(4)+3));
a10 = str2double(line3(strposl3(4)+4:strposl3(5)+3));
line4 = fgetl(b);
strposl4 = strfind(line4,'E');
a11 = str2double(line4(1:strposl4(1)+3));
a12 = str2double(line4(strposl4(1)+4:strposl4(2)+3));
a13 = str2double(line4(strposl4(2)+4:strposl4(3)+3));
a14 = str2double(line4(strposl4(3)+4:strposl4(4)+3));
% Range of temperature for which the Cp, H and S are calculated
T = linspace(l_low,l_high,100);
for i = 1:length(T)
[c_p,H,S] = calculating_therm_properties(a1,a2,a3,a4,a5,a6,a7,a8,a9,a10,a11,a12,a13,a14,l_mid,T)
end
% Changing the directory and save the plots in that directory
mkdir('E:\MATLAB_Course\File_Parsing_3',species_name)
cd(sprintf('E:\MATLAB_Course\File_Parsing_3\%s',species_name))
% Creating the plots
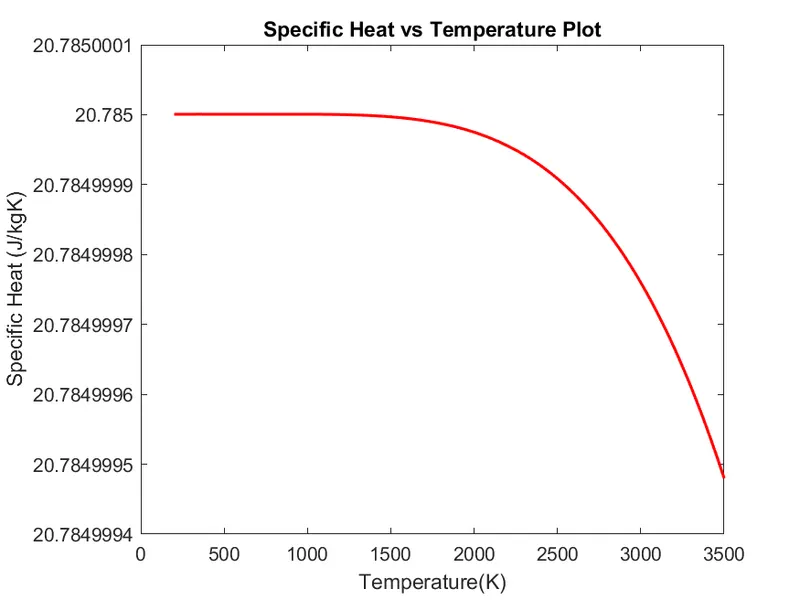
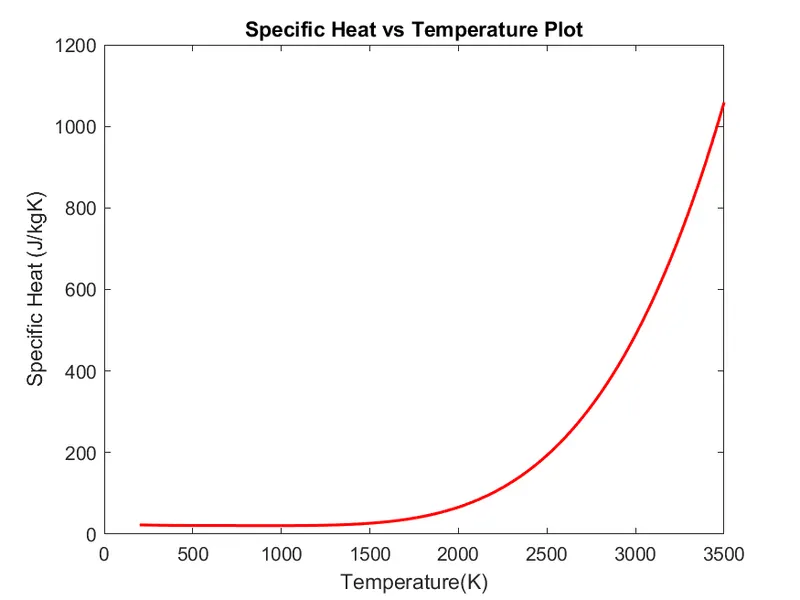
figure(1)
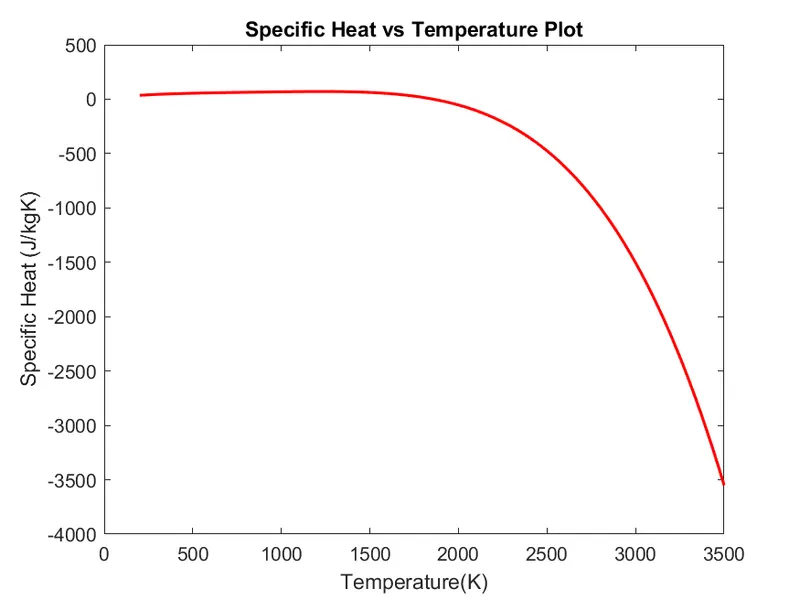
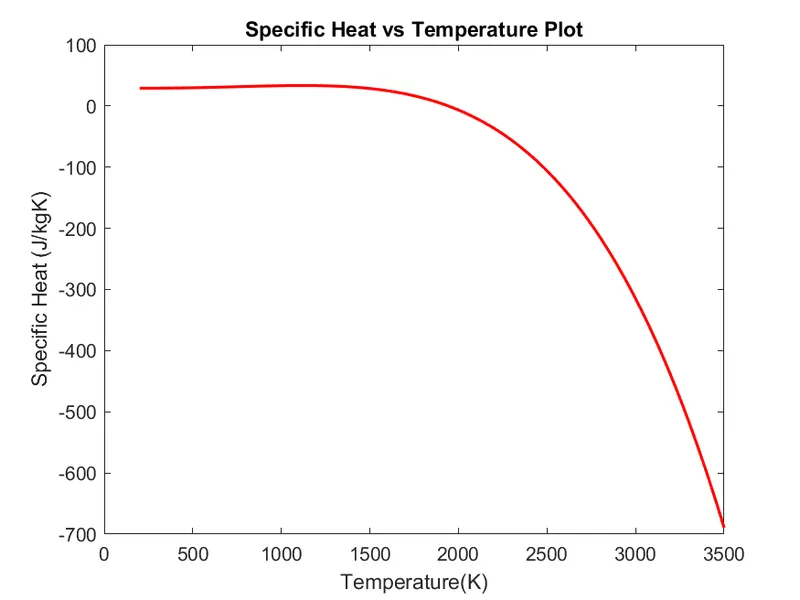
plot(T,c_p,'linewidth',1.5,'color','r')
xlabel('Temperature(K)');
ylabel('Specific Heat (J/kgK)');
title('Specific Heat vs Temperature Plot')
m1 = 'Specific Heat of %s';
m2 = species_name;
m3 = sprintf(m1,m2);
saveas(figure(1),sprintf('%s.png',m3))
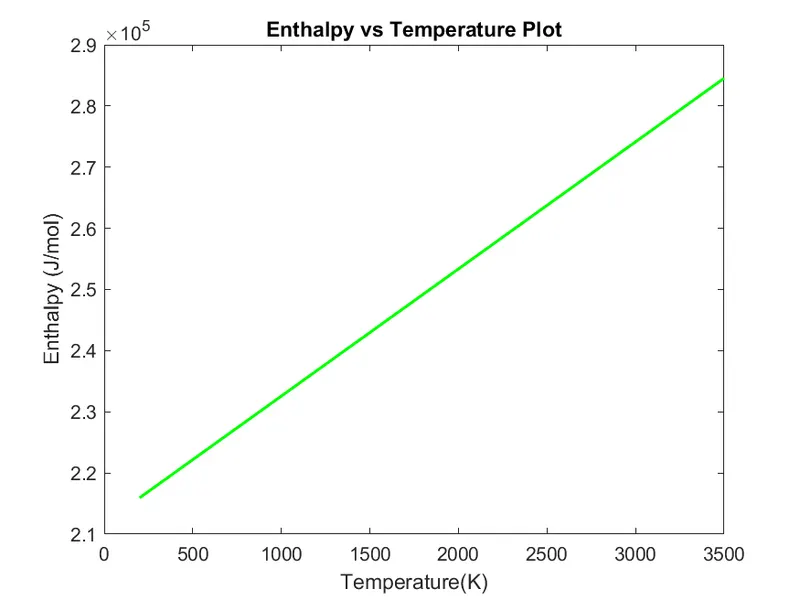
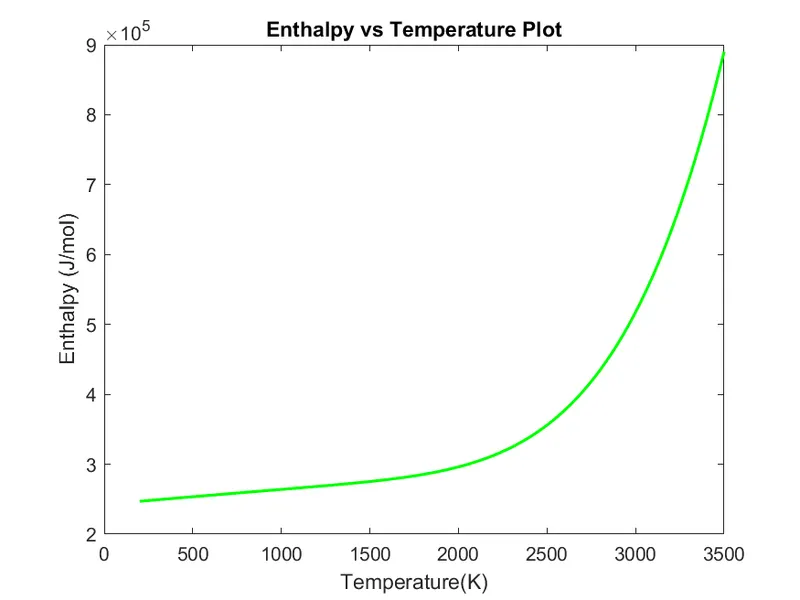
figure(2)
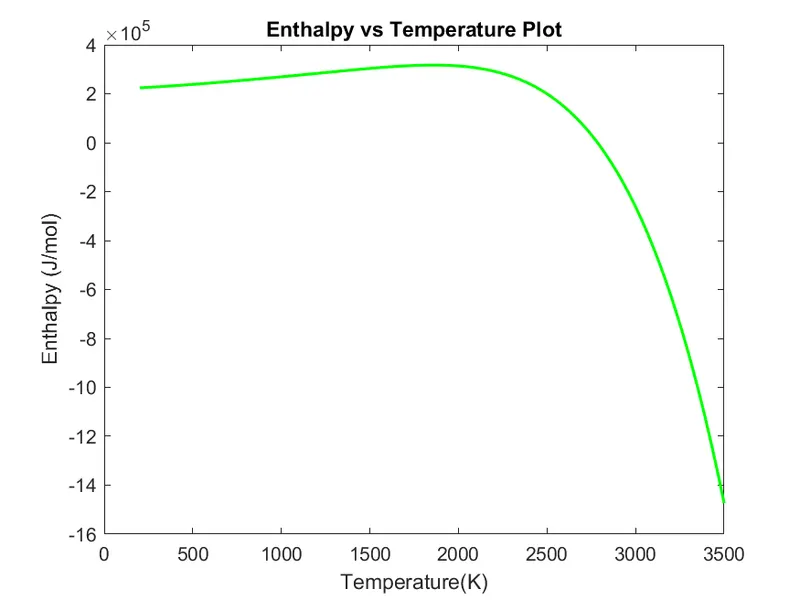
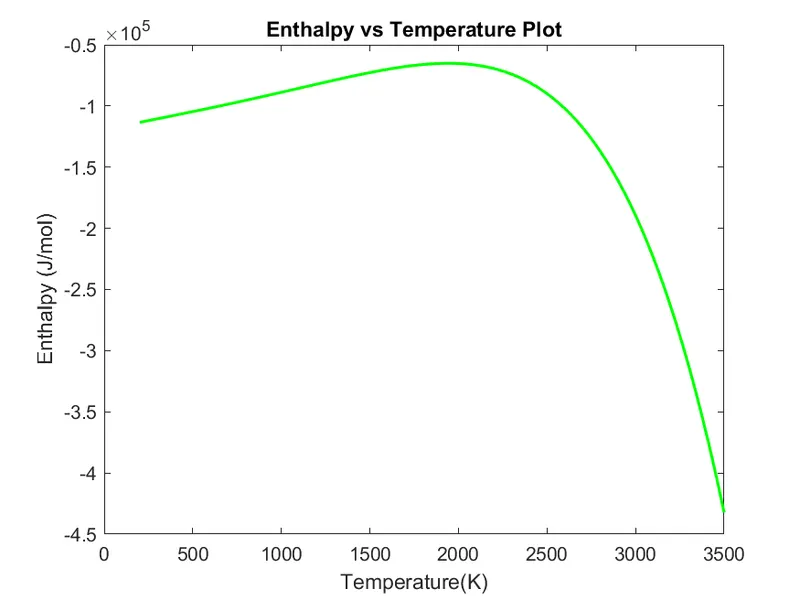
plot(T,H,'linewidth',1.5,'color','g')
xlabel('Temperature(K)');
ylabel('Enthalpy (J/mol)');
title('Enthalpy vs Temperature Plot')
m4 = 'Enthalpy(H) of %s';
m5 = species_name;
m6 = sprintf(m4,m5);
saveas(figure(1),sprintf('%s.png',m6))
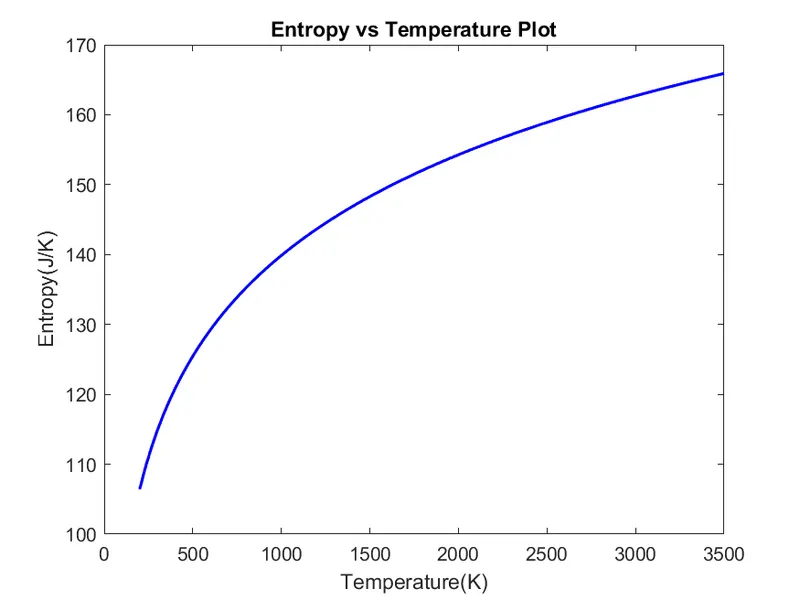
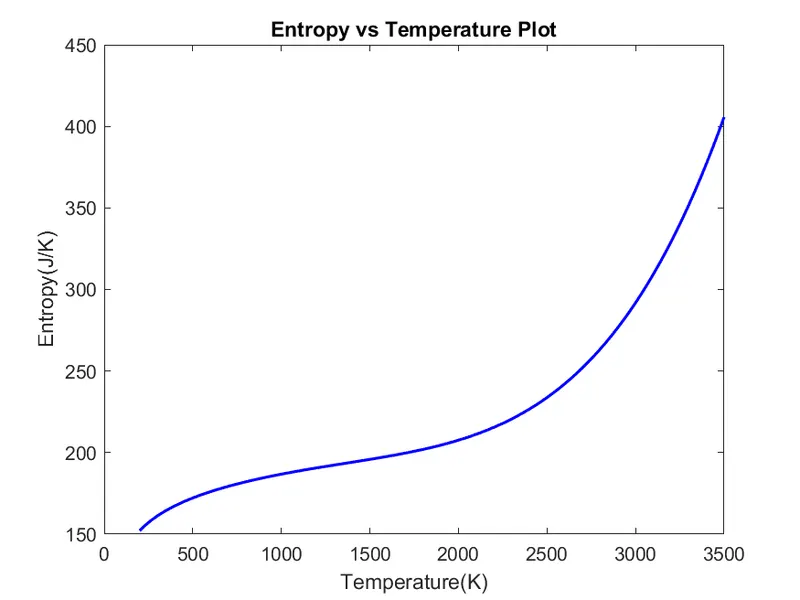
figure(3)
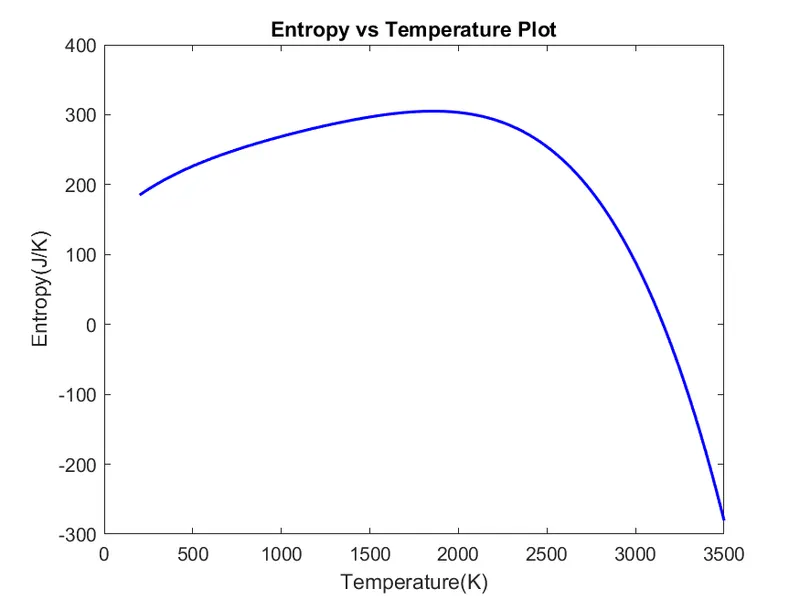
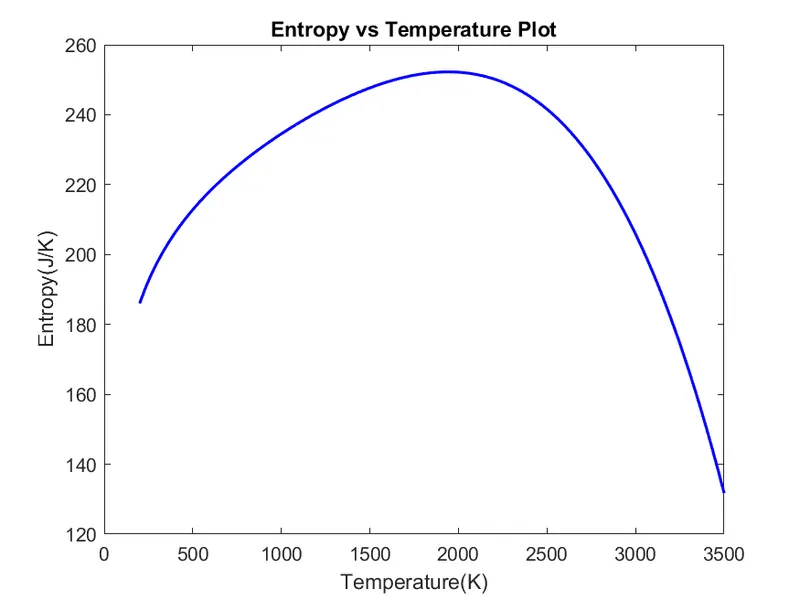
plot(T,S,'linewidth',1.5,'color','b')
xlabel('Temperature(K)');
ylabel('Entropy(J/K)');
title('Entropy vs Temperature Plot')
m7 = 'Entropy of %s';
m8 = species_name;
m9 = sprintf(m7,m8);
saveas(figure(1),sprintf('%s.png',m9))
% Changing back to the working directory
cd('E:\MATLAB_Course\File_Parsing_3')
% Calculating the molecular weight
[molecular_wt]=mw(species_name);
end
end
% Closing the file
fclose(b);
2. Outputs(Molecular weight and plots for C_p vs T, H vs T and S vs T:
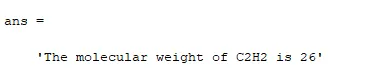
a. C2H2
Molecular weight:
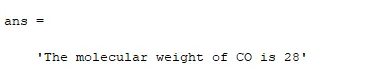
b. CO
Molecular weight:
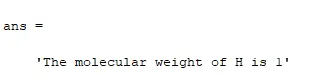
c. H
Molecular weight:
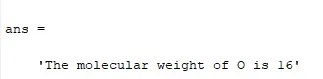
d. O
Molecular weight:
4. Storing all the plots of each species in separate folders with suitable naming
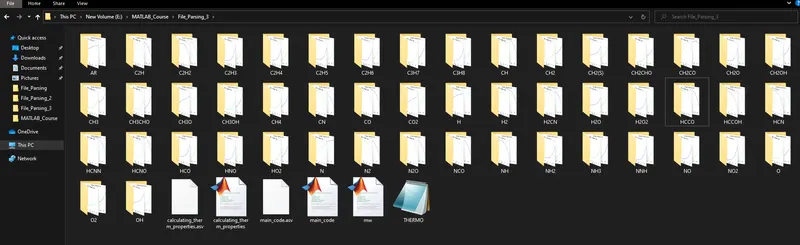
5. Main program already pasted above.