Week 6 - Data analysis
Objective: - To write a python program to perform data visualisation.
Problem Statement: -
1. Data Visualizer:
- To write a script that should take column numbers as the input and plot the respective columnn as separate images. File should be saved by the name of the column and the label information should automatically be extracted and must appear as labels in the plot.
2. Compatability check:
- The code should exit gracefully, if a non-compatible file is provided as an input. It should say something like "File not recognized. Please provide a valid CONVERGE output file".
3. Basic performance calculation:
- To calculate the area under the P-V diagram.
- To calculate the power output of this engine by assuming RPM = 1500.
- To calculate the specific fuel consumption of the engine. The engine consumed 20 micro grams of fuel (per 1 stroke cycle).
Theory: -
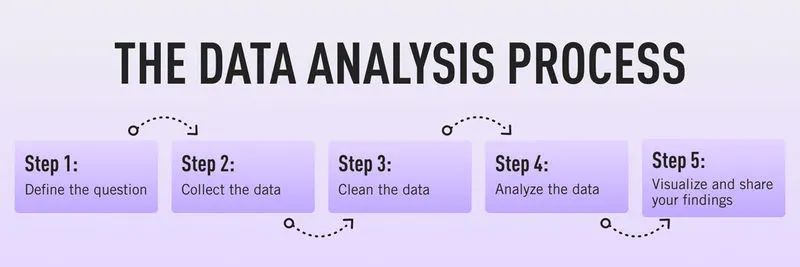
Data analysis is the process of cleaning, changing, and processing raw data, and extracting valuable, actionable, relevant information that helps in making informed decisions. The procedure helps reduce the risks inherent in decision-making by providing useful insights and statistics, often presented in charts, images, tables, and graphs. Data Analysis is important because it helps in recuding operational costs, provides better problem solving methods, helps in getting more accurate data.
Governing Equations: -
`Power Output=A.n.10^6` in Watts
`Power Output=A.n.10^3` in Kilowatts
where A = Area under P-V diagram = Work done by the engine (MJ)
n = Number of cycles per second
For 4-stroke: `n = N/(2X 60)`
For 2-stroke: `n = N/ 60`
N = Rotations per minute.
SFC(specific fuel consumption) = Fuel consumed(Kg/hr)/ Power Output(KW)
Solution Procedure:-
- "Numpy", "math" and "matplotlib" library are imported to perform array, mathematical operations and to plot graphs respectively.
- From "Numpy" library "trapz" function is imported to calculate the area under P-V diagram.
- From "prettytable" library "PrettyTable" function is imported to make tables.
- A variable 'data_file' is created to store the user's input file.
- To check the compatibility of the user's input file "try", "except" and "else" function are used. The try block tests a block of code for errors. The except block handles the error. The else block executes code when there is no error.
- Empty list named "columns_number", "column_names", "units" are created to store column number, thermodynamic parameters, units of the thermodynamic parameters in the file respectively.
- "for loop" is used to append the empty variables; "if loop" and ''if-else loop" are used to avoid the storage of irrelevant characters such as '#' and 'column'.
- A list named "columns" is created having the "columns_number","column_names"and "units" as the elements.
- A table is created using the function "PrettyTable" and stored in a variable "myTable". Then, the columns of the table are populated with the values of "columns_number","column_names"and "units".
- Variables 'a' and 'b' are created to store user-defined column numbers.
- Two empty list named 'x_data' and 'y_data' are created. Then, using for loop to read the file line by line. if loop is used to avoid reading lines consisting of irrelevant characters such as '#'.
- A variable named 'filename' is created where the name of the file is stored by the name of the column.
- An empty figure is created using "plt.figure()" function. "plt.plot(x,y)" function is used to plot the graph. The function plt.title(), plt.xlabel(),plt.ylabel(), plt.grid(), plt.savefig() are used to provide the graph with title, label x and y axes, put on the gridlines and save the figure respectively.
- To calculate engine performance, two variables 'x' and 'y' are created to store user defined column numbers corresponding to volume and pressure respectively.
- Two empty list 'V_data' and 'P_data' are created to store the value of volume and pressure respectively.Then, using for loop to read the file line by line. if loop is used to avoid reading lines consisting of irrelevant characters such as '#'.
- Finally, the area under P-V diagram using trapz function is calculated. The power output of the engine, specific fuel consumption of the engine are calculated by using the above equations
Program Code:-
# TO WRITE A PYTHON PROGRAM TO PERFORM DATA VISUALISATION
# SUBMITTED BY IRFAN SUNNY BARUAH ON 17/04/2022.
#=========================================================================================
import math
import matplotlib.pyplot as plt
import numpy as np
from numpy import trapz
from prettytable import PrettyTable
#------------------------------------------------------------------------------------------
# Defining a variable named 'data_file' where user's input file will be stored.
data_file = input('Enter the file name having proper extension:')
#-------------------------------------------------------------------------------------------
# To check the compatibility of the user's input file.
try:
	data = open(data_file,'r')
except:
	print('\nFile not recognized. Please provide a valid CONVERGE output file\n')
else:
	print('\nData file has been successfully opened\n')
#-------------------------------------------------------------------------------------------
# Creating an empty list named 'columns_number' to store column number.
columns_number = []
# Creating an empty list named 'column_names' to store thermodynamic parameters in the file.
column_names = []
# Creating an empty list named 'units' to store units of the thermodynamic parameters in the file.
units = []
# Creating a counter variable named 'line_count' for keeping track of count.
line_count = 1
# Using for loop to read the file line by line.
for line in data:
# for loop to append the empty variable 'columns_number'.
	for i in range(0,19):
# if loop to avoid the storage of irrelevant characters such as '#' and 'column'.
		if i>=2:
# if loop to store the number of columns in an empty array 'columns_number' from line number 2 of the file.
			if line_count == 2:
				columns_number.append(line.split()[i])
# for loop to append the empty variable 'column_names' and 'units'.
	for j in range(0,18):
# if loop to avoid the storage of irrelevant character such as '#'.
		if j>=1:
# if - else loop to store the name of columns and units in empty arrays 'column_names'and 'units' respectively from line number 3 and 4 of the file.
			if line_count == 3:
				column_names.append(line.split()[j])
			elif line_count == 4:
				units.append(line.split()[j])
	line_count= line_count + 1
#-------------------------------------------------------------------------------------------------------------------
# Creating a list named 'columns' having the  "columns_number","column_names"and "units" as the elements.
columns = ["columns_number","column_names", "units"]
# Creating the table using the function 'PrettyTable' and storing it in a variable 'myTable'
myTable = PrettyTable()
# The columns of the table are populated with the values of "columns_number","column_names"and "units".
myTable.add_column(columns[0], columns_number[0:])
myTable.add_column(columns[1], column_names[0:])
myTable.add_column(columns[2], units[0:])
# Printing the desired Table.
print(myTable)
#---------------------------------------------------------------------------------------------------------------------
# Printing general instructions for the user.
print('\nPick up two columns of your choice shown above in the table for plotting graph')
print('\nEnter two column numbers corresponding to column names 1 to 17\n')
# Creating variables 'a' and 'b' to store user-defined column number.
a = int(input('Enter a column number corresponding to X axis column name: '))
b = int(input('Enter a column number corresponding to Y axis column name: '))
# Creating two empty list named 'x_data' and 'y_data'.
x_data = []
y_data = []
# Creating a counter variable named 'line_count' for keeping track of count.
line_count = 1
# Using for loop to read the file line by line.
for line in open(data_file,'r'):
# if loop to avoid reading lines consisting of irrelevant characters such as '#'
	if '#' not in line:
		x_data.append(float(line.split()[a-1]))
		y_data.append(float(line.split()[b-1]))
	line_count = line_count + 1
# Creating a variable named 'filename' to store the name of the file.
filename = column_names[b-1]+' vs '+column_names[a-1]
# Creating an empty figure.
plt.figure()
# Plotting the figure.
plt.plot(x_data, y_data,color = 'red', linewidth = 3)
# Labeling the figure by extracting elements from 'column_names' and 'units' arrays.
plt.xlabel(column_names[a-1] + units[a-1])
plt.ylabel(column_names[b-1] + units[b-1])
# Adding title to the figure by extracting elements from 'column_names' array.
plt.title(column_names[b-1]+' vs '+column_names[a-1])
plt.grid()
# Saving the figure
plt.savefig(filename)
plt.show()
#-----------------------------------------------------------------------------------------------------------
# Engine Performance calculations
# Creating two variables 'x' and 'y' to store user defined column numbers corresponding to volume and pressure respectively.
x = int(input('\nEnter the column number corresponding to Volume(m^3): '))
y = int(input('Enter the column number corresponding to Pressure(MPa): '))
# Creating two empty  list 'V_data' and 'P_data' to store the value of Volume and Pressure respectively.
V_data = []
P_data = []
#Creating a counter variable named 'line_count' for keeping track of count.
line_count = 1
for line in open(data_file,'r'):
# if loop to avoid reading of the line that contains symbols such as '#'
	if '#' not in line:
		V_data.append(float(line.split()[x-1]))
		P_data.append(float(line.split()[y-1]))
	line_count = line_count + 1
#----------------------------------------------------------------------------------------------------------
print('\nCalculating the performance of the engine\n')
# Calculating the area under P-V diagram using trapezoidal rule.
Area = np.trapz(P_data,V_data)
print('Area under P-V diagram using trapezoidal rule:' + str(Area) + ' units ')
print('Work done by the engine:' + str(Area) + ' MJ ')
Area = Area*1e6
print('Work done by the engine:' + str(Area) + ' J ')
# Calculating the power output of the engine.
rpm = float(input('\nEnter the RPM of the engine: '))
n = rpm/(2*60)
power = (Area*n)/1000
print('Power output of the engine:' + str(power) + ' KW ')
# Calculating specific fuel consumption of the engine.
f_c = float(input('\nEnter the value of fuel consumed per cycle(in micrograms): '))
sfc = f_c/power
sfc = sfc*(3.6*1e-3)
print('Specific fuel consumption of the engine:'+str(sfc)+' Kg/KWhr ')
#===================================================================================================================
Result and Discussion:-
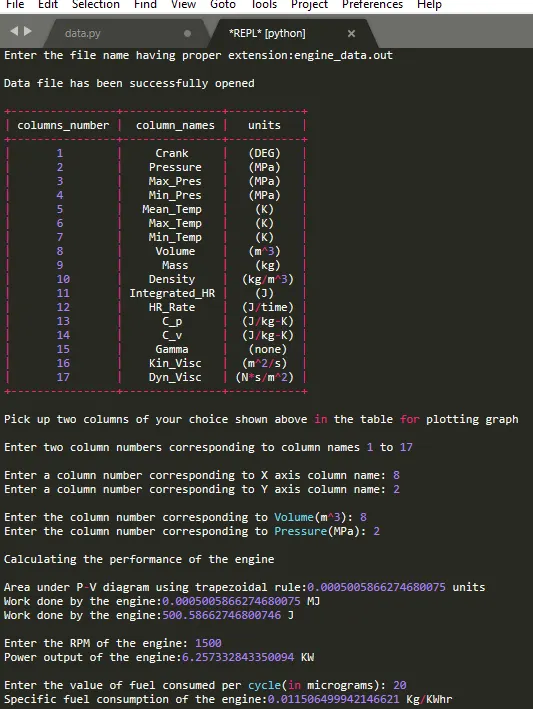
When the name of the file was typed in, it first checked for the compatibility of the file.
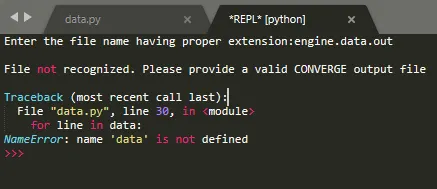
In the above figure, the file was not recognized because the name of the file typed in was wrong, although the file was in the folder.
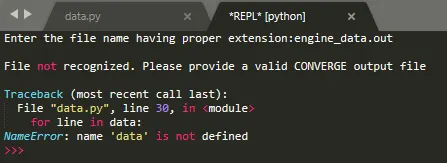
In this file, the file was not recognized because the file was not in the desired directory, although the name of file is correctly typed in.
Successful opening of the file without error.
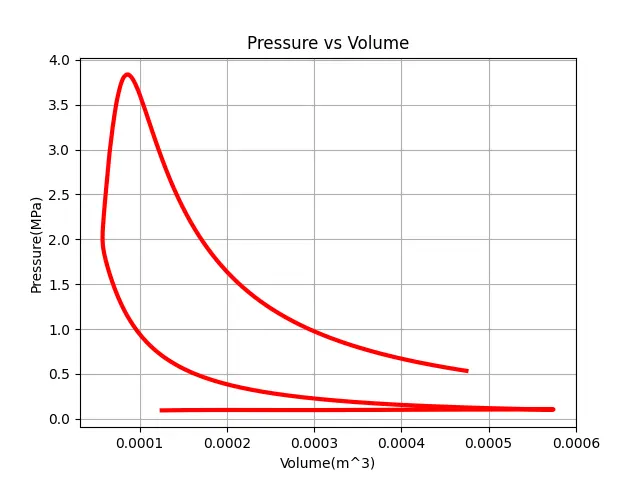
Graph between Pressure vs Volume:
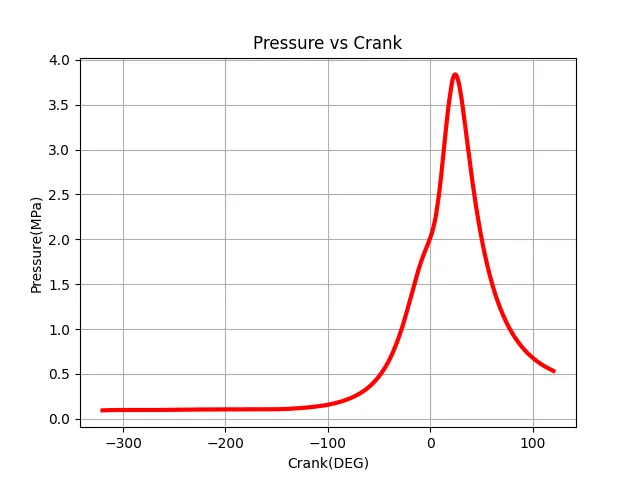
Graph between Pressure vs Crank: