Week 6 - Data analysis
AIM:
To write a script to perform data analysis
LANGUAGE: Python
Editor : Sublime Text
SUMMARY:
Objective
Concepts & Definition
Code and explanation
Conclusion
References
Objective:
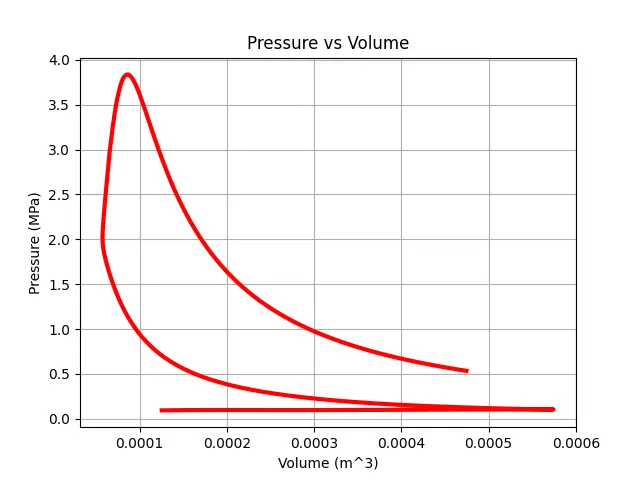
To perform data visualization: writing a program to take column numbers as the input and plot the respective columns as separate images which will be saved with the name of the column
To check the compatibility of the file
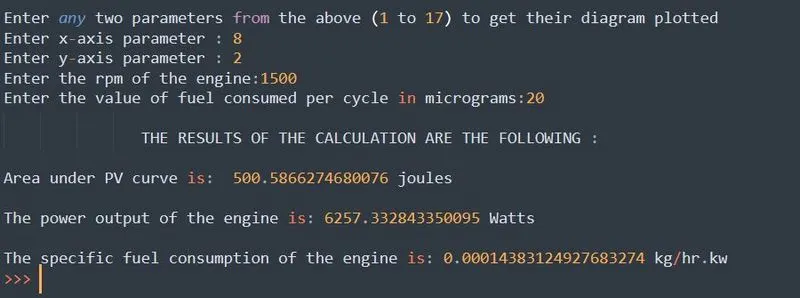
To perform calculation of area under the P-V diagram, the power output of this engine, and the specific fuel consumption of the engine.
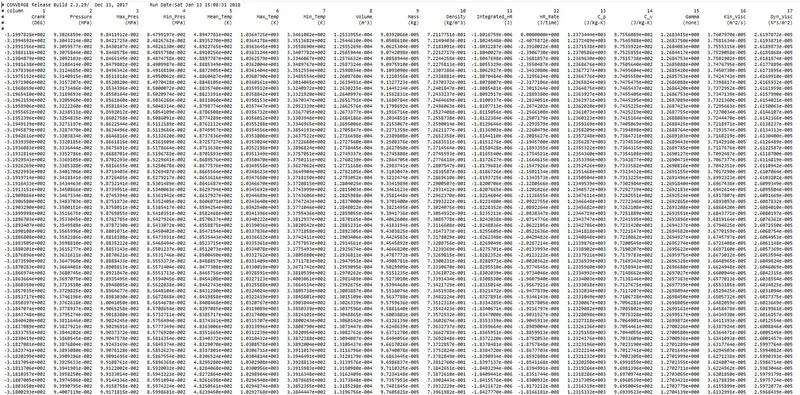
Here we are going to work on the following file whose name is engine_data.out :
Concepts & Definition
Parsing also called syntax analysis or syntactic analysis is the process of analyzing a string of symbols, either in natural language, computer languages or data structures, conforming to the rules of a formal grammar. In computer science parsing refers to how data can be read from a file and how that information can be handled.
Code and explanation
"""
Thermodynamics file Parsing
Wrote by KODOUI Dieu-Donné
"""

#Importing the required libraries
import matplotlib.pyplot as plt
import math
import numpy as np
from numpy import trapz  #for erea calculation

#Compatability checking
print('\nMake sure your data file is in same folder as your python code' )
file_name=input('\nEnter the name of your file with .out extension : ')
try:
	contents=open(file_name,'r')
	print("\nSuccessful! ")
except FileNotFoundError:
	print("\nFile not recognized. Please provide a valid CONVERGE output file\n")
'''
finally:
  print("The file verification is complete\n")
'''

#File opening
contents = open(file_name,'r')

#Basic Initialization
column_numbers =[]
parameters=[]
Units=[]

#Beginning file parsing
line_counter=1
for line in contents:
	if line_counter==3:
		parameters = line.split()

		column_numbers = len(parameters)
		print('\nThis file contains data derived from IC engine simulation')
		print('It has total %d columns of various data'%(column_numbers-1))

		for unit_line in contents:
			if line_counter==4:
				Units=unit_line.split()
			break


		for column_number in range (1,column_numbers):
			print(column_number,'-',parameters[column_number]+' '+ unit_line.split()[column_number])

		break

	line_counter = line_counter+1

#Let's ask the user to enter the desired parameters
print("\nEnter any two parameters from the above (1 to 17) to get their diagram plotted")
x=int(input(('Enter x-axis parameter : ')))
y=int(input(("Enter y-axis parameter : ")))

x_data = []
y_data = []

contents=open(file_name,'r')
line_counter = 1
for line in contents:
	if line_counter==3:
		X_label = line.split()[x]
		Y_label = line.split()[y]


		if line_counter<=4:
			x_label=line.split()[x] +' '+ unit_line.split()[x]
			y_label=line.split()[y] +' '+ unit_line.split()[y]

	if '#' not in line:
		x_data.append(float(line.split()[x-1]))
		y_data.append(float(line.split()[y-1]))


		#print(y_data)

	line_counter=line_counter+1


#Basic performance calculation
if x==8 and y==2:

	Rpm=float(input('Enter the rpm of the engine:'))
	f=float(input('Enter the value of fuel consumed per cycle in micrograms:'))
	#Number of cycles per second for a 4 stroke engine
	n=Rpm/(2*60)
	#Converting Pressure into pascal
	P=1000000*np.array(y_data)
	V=np.array(x_data)
	#Calculating the area under PV curvem in Joules
	A= np.trapz(P,V)

	#Computing the power output of the engine
	Power=A*n

	#Calculating the specific fuel consumption
	fc=(f*n*3600)/pow(10,9) #in kg/hr
	sfc=(fc*1000)/Power#in kg/hr.kw
	print('\n               THE RESULTS OF THE CALCULATION ARE THE FOLLOWING :        ')
	print('\nArea under PV curve is: ',A,'joules')
	print('\nThe power output of the engine is:', Power,'Watts')
	print('\nThe specific fuel consumption of the engine is:',sfc,'kg/hr.kw')

#File naming
filename = Y_label + '_vs_' + X_label + '.png'

#Plotting
plt.figure()
plt.plot(x_data,y_data,color='r',linewidth=3)
plt.xlabel(x_label)
plt.ylabel(y_label)
plt.title(Y_label + ' vs ' + X_label)
plt.grid()
plt.savefig(filename)
plt.show()
Output:
For example plot between column 1 (crank angle) and column 8(volume):
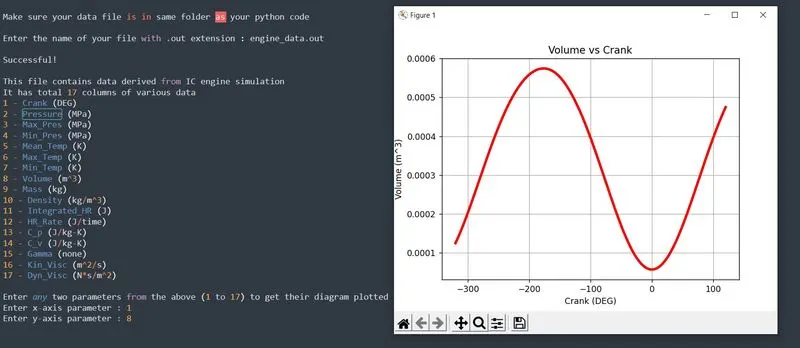
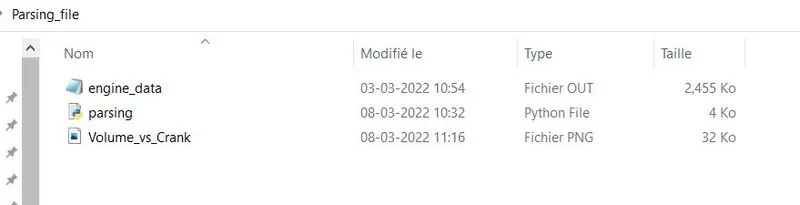
The file was created automatially
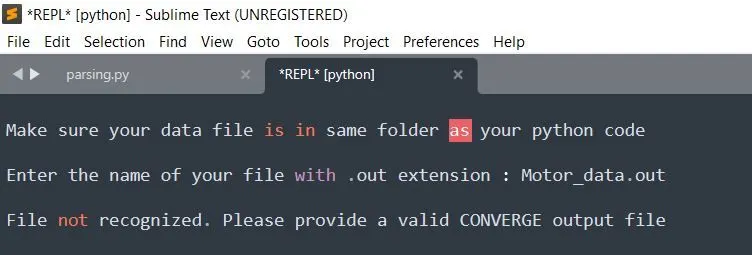
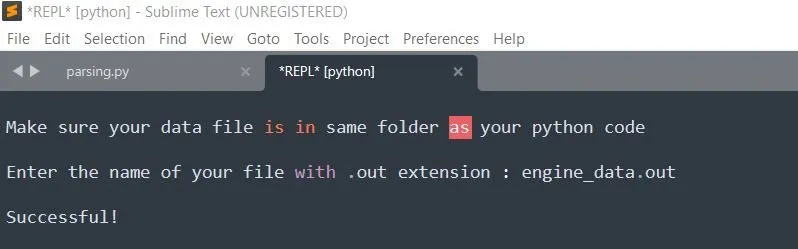
Compatability check:
When putting wrong or right file name
Basic performance calculation
Conclusion:
Parsing is a technique very useful helping to read informations from files and handle them. With this project it is clear that the input may just be a simple file and the rest remains in the art of handling it. Hence all the aspects of this technique become clear and understandable.
References
https://numpy.org/doc/stable/reference/generated/numpy.trapz.html