Week 6 - Data analysis
Data Analysis
Aim- To study Data Analysis
Objective-
- To study data analysis
- To power output of engine
- To calculate specific fuel consumption of engine
Theory-
File parsing means, to a computer, about what “reading text” means to a human being. You scan it, from start to finish, and figure out what it means as you go - whether you’re” a person reading text or a computer parsing a file.
Problem Statement-
- Your script should take column numbers as the input and plot the respective columns as separate images
- Each file should be saved by the name of the column
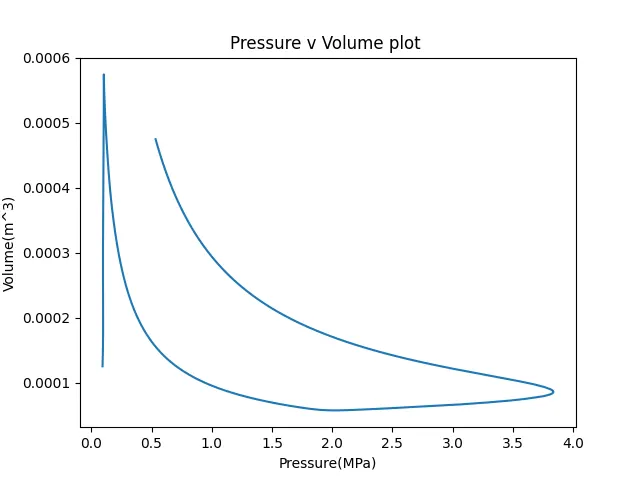
- The plot labels should be extracted from the file. If, I request for a plot between column 1 (crank angle) and column 8(volume), then the label information should automatically be extracted and must appear as labels in the plots. THIS SHOULD NOT BE DONE MANUALLY
- Calculate the area under the P-V diagram. P is in column 2 and V is in column 8.
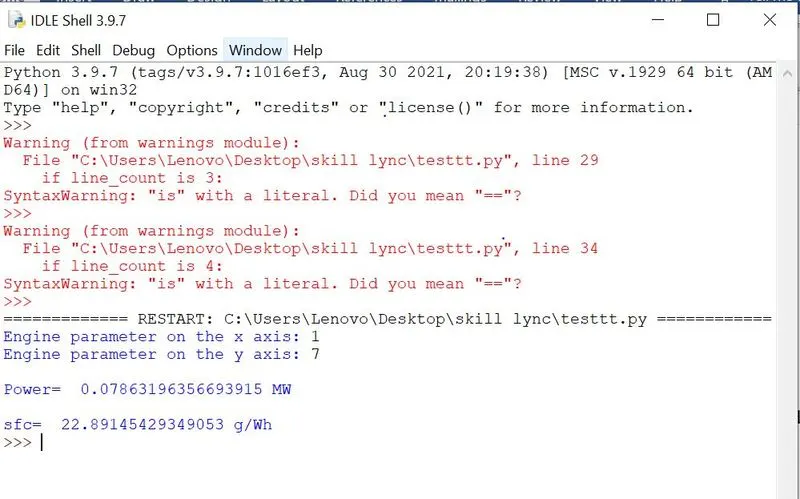
- Calculate the power output of this engine. Assume that RPM is 1500
- This engine consumed 20 micro grams of fuel (per 1 stroke cycle). Calculate its specific fuel consumption
Calculation-
- Torque = Area under P-V curve
- Power=2πNT/60
Where, N=1500rpm
T= Torque
- Specific Fuel Consumption=mf N×10-6×3600/power×60
Where, mf = mass flow rate of fuel
import matplotlib.pyplot as plt
import numpy as np
import math
#Assigning an empty array to all the engine parameters
Crank = []
Pressure = []
Max_Pres = []
Min_Pres = []
Mean_Temp = []
Max_Temp = []
Min_Temp = []
Volume = []
Mass = []
Density = []
Integrated_HR = []
HR_Rate = []
C_p = []
C_v = []
Gamma = []
Kin_Visc = []
label=[]
Units=[]
Dyn_Visc=[]


line_count = 1
for line in open('engine_data.out','r'):
    if '#' in line:
        if line_count is 3:
            for j in range(1,18):
                label.append(line.split()[j])


        if line_count is 4:
            for k in range(1,18):
                Units.append(line.split()[k])
        line_count = line_count + 1

    if '#' not in line:
        Crank.append(float(line.split()[0]))
        Pressure.append(float(line.split()[1]))
        Max_Pres.append(float(line.split()[2]))
        Min_Pres.append(float(line.split()[3]))
        Mean_Temp.append(float(line.split()[4]))
        Max_Temp.append(float(line.split()[5]))
        Min_Temp.append(float(line.split()[6]))
        Volume.append(float(line.split()[7]))
        Mass.append(float(line.split()[8]))
        Density.append(float(line.split()[9]))
        Integrated_HR.append(float(line.split()[10]))
        HR_Rate.append(float(line.split()[11]))
        C_p.append(float(line.split()[12]))
        C_v.append(float(line.split()[13]))
        Gamma.append(float(line.split()[14]))
        Kin_Visc.append(float(line.split()[15]))
        Dyn_Visc.append(float(line.split()[16]))

Inp = np.array([Crank, Pressure, Max_Pres, Min_Pres, Mean_Temp, Max_Temp, Min_Temp, Volume, Mass,Density, Integrated_HR, HR_Rate, C_p, C_v, Gamma, Kin_Visc, Dyn_Visc])


x = input("Engine parameter on the x axis: ")
x = int(x)
y = input("Engine parameter on the y axis: ")
y = int(y)
plt.plot(Inp[x],Inp[y])
plt.title(str(label[x]) + ' v ' + str(label[y]) + ' plot ')
plt.xlabel(str(label[x]) + str(Units[x]))
plt.ylabel(str(label[y]) + str(Units[y]))
plt.savefig(str(label[x]) + 'v' + str(label[y]))
plt.show()

if x==1 and y==7:
    m=20
    N=1500
    T=np.trapz(Inp[x],Inp[y])
    power=(2*math.pi*N*T)/(60)
    sfc=(m*N*pow(10,-6)*3600)/(power*60)
    print('\nPower= ',power,'MW')
    print('\nsfc= ',sfc,'g/Wh')
Explanation-
- Imported math module for calculation
- Imported matplotlib model for plotting velocities and displacement
- Imported NumPy module for array
- Assigning Empty array for engine parameters
- For loop is taken to read the data
- Data is stored in arrays
- Defined another array to store names of parameter
- Input is defined
- Plotted parameters using plt.
- Area under the P-V diagram is calculated
- Calculated power and specific fuel consumption
Result-
- P-V Diagram
- Calculations
Conclusion-
Successfully plotted IC Engine parameters
Successfully Calculated torque, power and specific fuel consumption