Week 6 - Data analysis
Skill-lync Python project 3
Aim: The objective of this assignment is to generate a Python code that can read & process data from the given input file and present the results in the desired manner. The code is to generate plots for a selected data set and compute other parameters using this data set.
Problem statement: The data file used for this assignment is a CONVERGE output file (.out) that contains data obtained from an IC engine simulation. The different types of data values of this file are listed in the table below.
Table 1: Contents of input file
|
Column no. |
Quantity |
Unit |
|
1 |
Crank angle |
Deg |
|
2 |
Pressure |
MPa |
|
3 |
Maximum pressure |
MPa |
|
4 |
Minimum pressure |
MPa |
|
5 |
Mean temperature |
K |
|
6 |
Maximum temperature |
K |
|
7 |
Minimum temperature |
K |
|
8 |
Volume |
m3 |
|
9 |
Mass |
Kg |
|
10 |
Density |
Kg/m3 |
|
11 |
Integrated HR |
J |
|
12 |
HR rate |
J/sec |
|
13 |
Cp |
J/Kg*K |
|
14 |
Cv |
J/Kg*K |
|
15 |
γ |
- |
|
16 |
Kinematic viscosity |
m2/sec |
|
17 |
Dynamic viscosity |
N*sec/m2 |
The final code is to perform the following functions: -
- The code is to accept only files of the .out file format.
- The code is to extract the data from the file and store the values in each column in separate arrays.
- The code is to use two columns as inputs to plot a 2D graph of these values.
- Once the functions above are complete, the code is to compute the total area under the pressure vs. volume plot, which is the energy output per cycle.
- This computed area is to be used to compute the power output, assuming an engine speed of 1500 rpm or 25 rev/sec.
- Finally, the code is to compute the specific fuel consumption, assuming that each stroke cycle consumes 20 micrograms or 2 X 10⁻⁸ kg per stroke cycle.
Theory: The energy output per cycle for a combustion engine is given by the area covered by the pressure curve in the graph shown below.
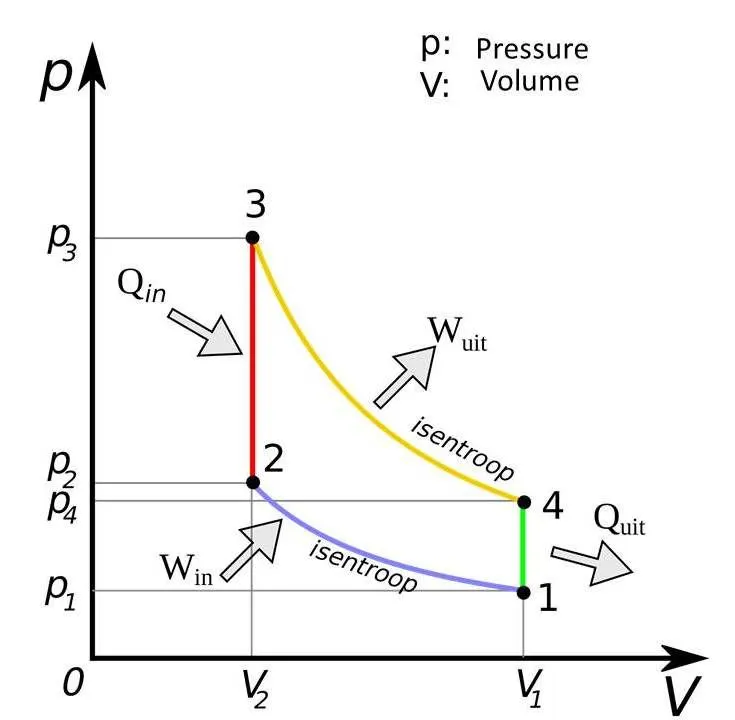 Figure 1: Pressure vs. volume curve of a typical combustion engine
The area covered here is given by integration of pressure over the volume, as shown by the equation below.
W = ʃP*dV
If the speed of the engine (N in rev/sec) is considered, the overall power output of the engine is given by the following formula.
P = W*N
Similarly, this engine speed can be used to compute the specific fuel consumption through the following formula.
Fuel rate = m*N (m = fuel consumption per cycle)
Software used: The code is built in the Python programming language, with the aid of Sublime text editor. This text editor uses a modified Python build system that allows for user inputs.
Procedure: The lines of the code generated for the data analysis operation are explained below.
- The first lines of the code are used to import the math, matplotlib, numpy and scipy modules.
- The engine’s assumed operating parameters are then defined.
- The next lines of code use a while loop to check for the .out extension in the file name, in order to ensure that the input file is of the right format, as shown below.
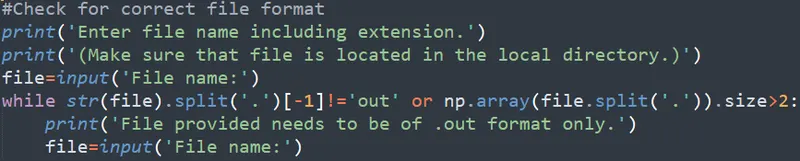 Figure 2: Code for verifying file format
If the filename with incorrect file format is input, an error message is displayed and the code loops repeatedly until the filename with the correct file format is input.
- The next lines of code are then defined to extract the data from the input file, as shown below.
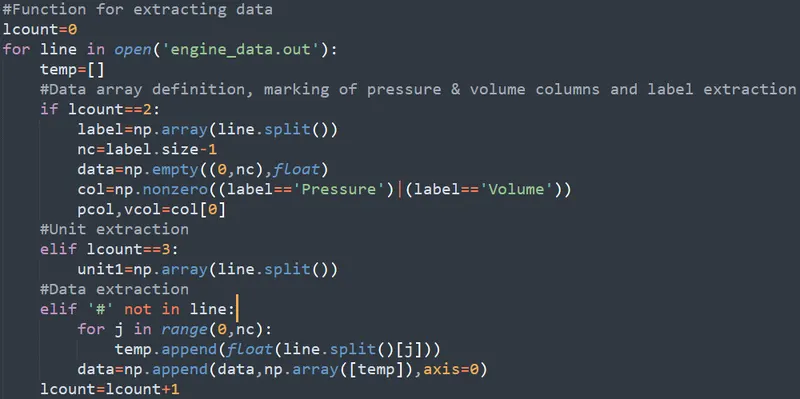 Figure 3: Code for data extraction
- Here, the first ‘if’ condition extracts the label information for the data from the file’s second line and assigns them to a label array. It also computes the total number of parameters in the input file and uses this number to define a 2D array for storing all the extracted numerical data. It also records the array indices corresponding to pressure & volume.
- The second ‘if’ condition extracts the unit information for the data from the file’s third lines and assigns it to a unit array.
- The third ‘if’ condition disregards all the commented lines, extracts the data from the remaining lines individually, and assigns the data to their respective places in the 2D array.
- A function is then defined to take 2 inputs and plot the data that is referred by these inputs, along with their respective labels and units, as shown below.
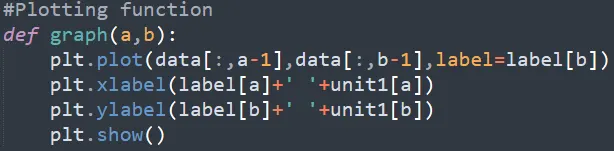 Figure 4: Function for plotting 2 parameters
- The next lines of code demand 2 inputs from the user. These inputs refer to the type of data that the user wishes to plot. These inputs are then used in the called plotting function, as shown below.
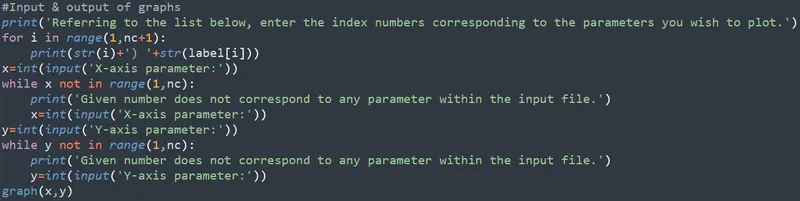 Figure 5: Code for requesting input parameters for plot
- The final lines of code shown below use the indices for the pressure & volume data to compute energy output per cycle, and consequently, the total power output and the specific fuel consumption.
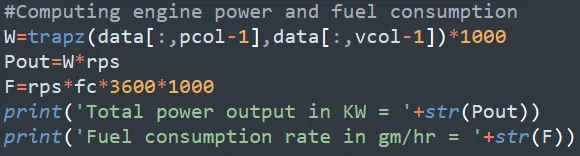
Figure 6: Power output and fuel consumption computation
The energy output per cycle is computed with the trapz function, which is a function that computes the integral of the pressure curve using the trapezoid rule.
Result: The final code for the data analysis is shown below.
import math
import matplotlib.pyplot as plt
import numpy as np
from scipy.integrate import trapz

#Engine parameters
rps=25
fc=2e-8

#Check for correct file format
print('Enter file name including extension.')
print('(Make sure that file is located in the local directory.)')
file=input('File name:')
while str(file).split('.')[-1]!='out' or np.array(file.split('.')).size>2:
	print('File provided needs to be of .out format only.')
	file=input('File name:')

#Function for extracting data
lcount=0
for line in open('engine_data.out'):
	temp=[]
	#Data array definition, marking of pressure & volume columns and label extraction
	if lcount==2:
		label=np.array(line.split())
		nc=label.size-1
		data=np.empty((0,nc),float)
		col=np.nonzero((label=='Pressure')|(label=='Volume'))
		pcol,vcol=col[0]
	#Unit extraction
	elif lcount==3:
		unit1=np.array(line.split())
	#Data extraction
	elif '#' not in line:
		for j in range(0,nc):
			temp.append(float(line.split()[j]))
		data=np.append(data,np.array([temp]),axis=0)
	lcount=lcount+1

#Plotting function
def graph(a,b):
	plt.plot(data[:,a-1],data[:,b-1],label=label[b])
	plt.xlabel(label[a]+' '+unit1[a])
	plt.ylabel(label[b]+' '+unit1[b])
	plt.show()

#Input & output of graphs
print('Referring to the list below, enter the index numbers corresponding to the parameters you wish to plot.')
for i in range(1,nc+1):
	print(str(i)+') '+str(label[i]))
x=int(input('X-axis parameter:'))
while x not in range(1,nc):
	print('Given number does not correspond to any parameter within the input file.')
	x=int(input('X-axis parameter:'))
y=int(input('Y-axis parameter:'))
while y not in range(1,nc):
	print('Given number does not correspond to any parameter within the input file.')
	y=int(input('Y-axis parameter:'))
graph(x,y)

#Computing engine power and fuel consumption
W=trapz(data[:,pcol-1],data[:,vcol-1])*1000
Pout=W*rps
F=rps*fc*3600*1000
print('Total power output in KW = '+str(Pout))
print('Fuel consumption rate in gm/hr = '+str(F))
As intended, this code only accepts files of the proper .out file format. The file is not accepted if the name contains multiple ‘.’ characters or lacks the ‘.out’ at the end of the name. The only flaw that could not be eliminated is that the code cannot deal with the absence of the input file in the local directory.
The data extraction also works as intended. One unusual quirk with this code exists in the 3rd if condition. When the temporary array is appended not with the for loop, but directly by using the np.array function with the split function, the total run time increases nearly 20 fold. While the assignment requires that the individual parameters be stored in separate arrays, it has ultimately been proven that the use of a single 2D array for the entire data is a more efficient alternative.
2 of the possible plots are also illustrated below.
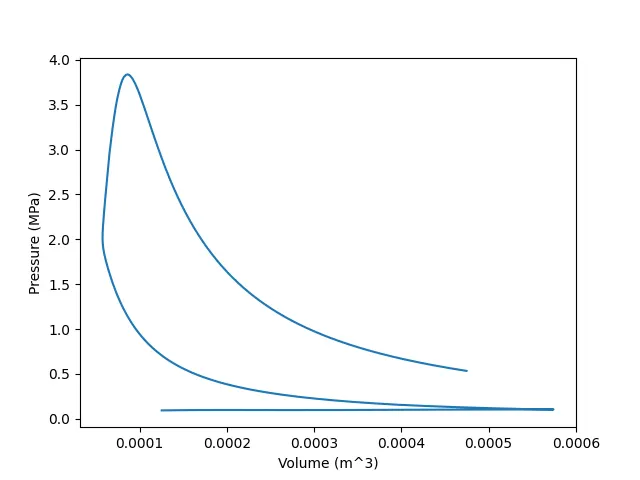 Figure 7: Pressure vs. volume curve
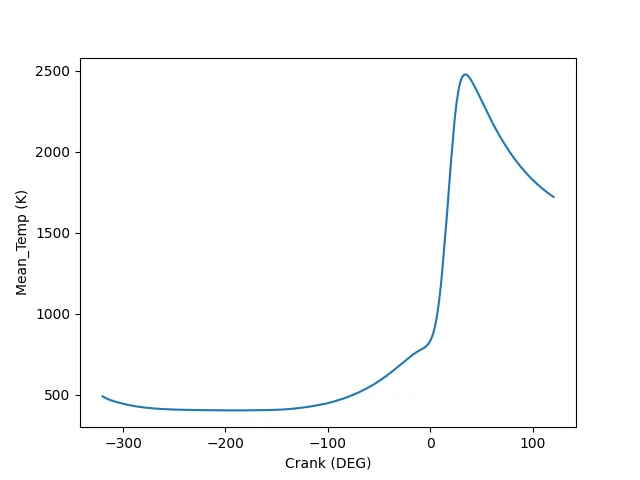 Figure 8: Mean temperature vs. crank angle
They show the correct parameters for their respective axes, complete with their labels and units.
The computed power output for the given input file is 12.515 KW, while the specific fuel consumption is 1.8 gm/hr.
Conclusion: The Python code for the purpose of data analysis has been successfully built. The final code does all the expected operations automatically, from checking for correct file format, to proper data extraction and presentation.