Week 6 - Data analysis
Aim:
To be able to develop a software that reads data, checks it, calculates the work done by the engine, as well as the engine's particular fuel consumption, and plots the graphs that are needed for analysis.
Objectives:
TASK 1 - To make a Data visualizer:
The script should be able to take column numbers as input and plot each column as a distinct image. Each file should be named after the column it belongs to.
The file's plot labels should be extracted.
TASK 2 - Compatibility check:
If an incompatible file is supplied as an input, the function should gracefully quit. It should state something along the lines of "Please provide converge output file to process"
TASK3 - Basic performance calculation:
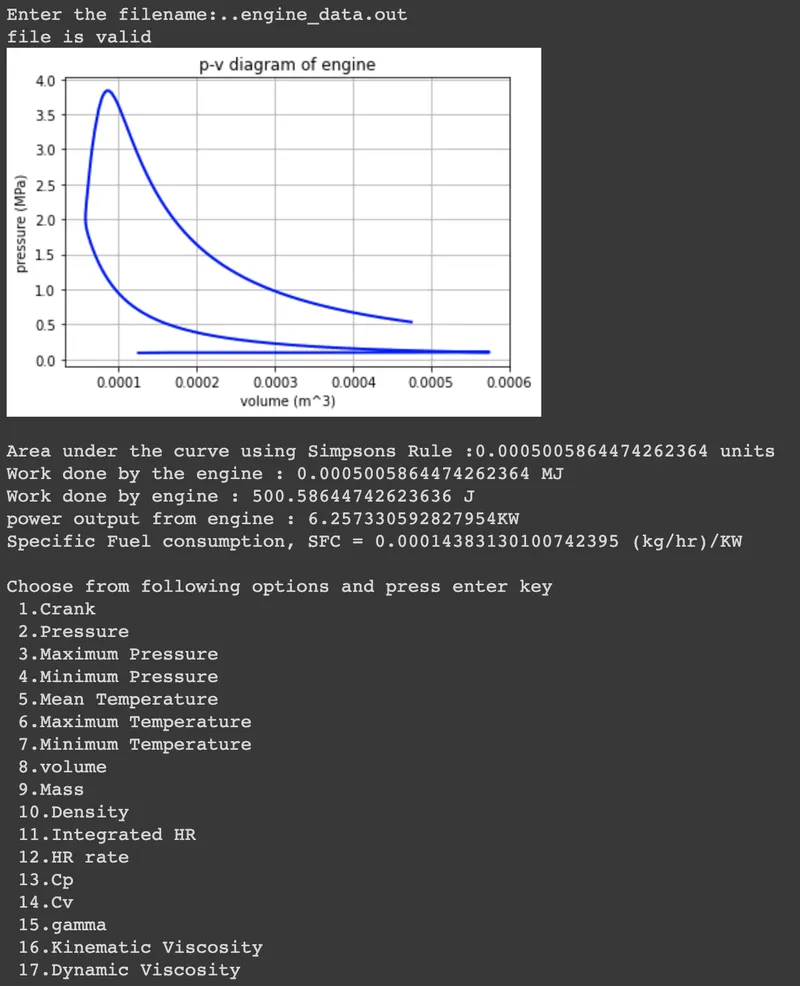
Calculate the area under the P-V diagram. P is in column 2 and V is in column 8.
Calculate the power output of this engine. Assume that RPM is 1500
This engine consumed 20 micrograms of fuel (per 1 stroke cycle). Calculate its specific fuel consumption.
Solution Flow:
- We must first check for file compatibility before determining whether or not the file is present. After that, we must collect column number inputs from the user.
- We'll next run line by line using a for loop to get the labels for the graphs and data. The data will subsequently be stored in empty arrays.
- The graphs may then be plotted and labelled using the matplotlib library.
Using the governing equations, we can calculate all the required parameters.
Code:
import math
import matplotlib.pyplot as plt
import numpy as np
from scipy.integrate import simps

#Compatibility check
fname = input("Enter the filename:..")

if fname == 'engine_data.out':
	print('file is valid')
else:
	print('file is invalid')

	exit()

def compatibility_check(a):
	if 'CONVERGE' not in a:
		print('Please provide converge output file to process')
		exit()
	else:
		print('Compatibility check is successful')
		pass

#try:
open('engine_data.out')


line_count = 1

# Creating an empty array to store the values of volume and pressure respectively
volume =[]
pressure =[]

v = 8
p = 2

# Creating null array and storing all the values of data file in to it

data =[]

for line in open('engine_data.out'):
	if '#' not in line:
	  data.append(line.split())
	  if line_count >= 6:
	  	volume.append(float(line.split()[v-1]))
	  	pressure.append(float(line.split()[p-1]))

	line_count = line_count + 1

#plotting p-v diagram
plt.plot(volume, pressure, linewidth = 2, color = 'b')
plt.xlabel('volume (m^3)')
plt.ylabel('pressure (MPa)')
plt.title("p-v diagram of engine")
plt.grid()
plt.show()

#integrating to find the area under the curve
area = simps(pressure,volume)
print('\nArea under the curve using Simpsons Rule :' +str(area) + ' units')
print('Work done by the engine : ' + str(area) + ' MJ')
area = area * 1e6
print('Work done by engine : ' + str(area) + ' J')

# Inputs
# Speed of an Engine
rpm = 1500
rps = 1500/60
stroke_cycle = rps/2

fuel_consumption = 20

# Engine specifications
# Number of cylinder
n = 1

# Calculation of power output and Specific fuel consumption
power_output = n*area*stroke_cycle/(1000)
print('power output from engine : ' + str(power_output) + 'KW')
SFC = (fuel_consumption*pow(10,-6)*stroke_cycle*3600)/(power_output*1000)
print('Specific Fuel consumption, SFC = ' + str(SFC) + ' (kg/hr)/KW')
print('')


# Transposing columns in to row matrix and converting them in to float type from string type
tp = np.transpose(data)
float_data  = tp.astype(np.float)

# Array for header and their units
parameters = ['Crank','Pressure','Maximum Pressure','Minimum Pressure','Mean Temperature','Maximum Temperature','Minimum Temperature','volume','Mass','Density','Integrated HR','HR rate','Cp','Cv','gamma','Kinematic Viscosity','Dynamic Viscosity']
units = ['(DEG)','(Mpa)','(Mpa)','(Mpa)','(K)','(K)','(K)','(m^3)','(kg)','(kg/m^3)','(J)','(J)','(J/time)','(J/kgK)','(J/kgK)','','m^2/s','(Ns/m^2']

# Providing user choice of picking 2 parameters for plotting
print('Choose from following options and press enter key')
print(' 1.Crank \n 2.Pressure \n 3.Maximum Pressure \n 4.Minimum Pressure \n 5.Mean Temperature \n 6.Maximum Temperature \n 7.Minimum Temperature \n 8.volume \n 9.Mass \n 10.Density \n 11.Integrated HR \n 12.HR rate \n 13.Cp \n 14.Cv \n 15.gamma \n 16.Kinematic Viscosity \n 17.Dynamic Viscosity\n')

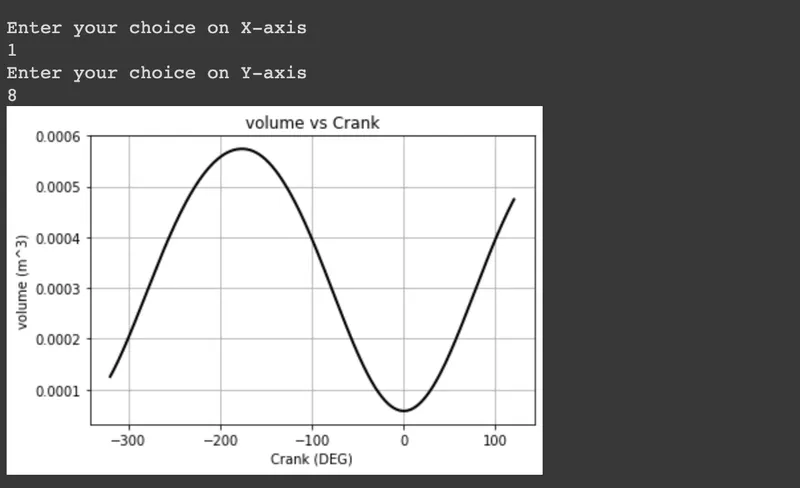
X = int(input('Enter your choice on X-axis \n'))

Y = int(input('Enter your choice on Y-axis \n'))


# Plotting hr figure based on user choice
plt.figure(1)
plt.plot(float_data[X-1],float_data[Y-1],linewidth=2, color = 'black')
plt.title(parameters[Y-1]+ ' vs ' +parameters[X-1])
plt.xlabel(parameters[X-1] + ' ' +units[X-1])
plt.ylabel(parameters[Y-1] + ' ' +units[Y-1])
plt.grid()
plt.show()
Output: