Week 6 - Data analysis
Data analysis
1. AIM:
- Develop a Python code that perform extraction and data analysis related to a data file.
2. OBJECTIVES:
- Create a program that takes column numbers as the input and plot the respective columns as separate images.
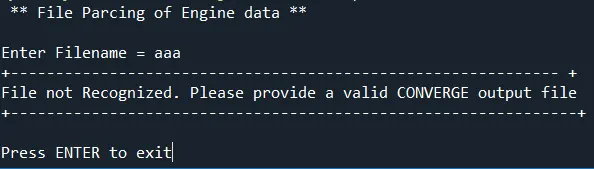
- Create a Python program that if wrong file name is provided, a message should display "File not recognized".
- Calculate area under the P-V diagram.
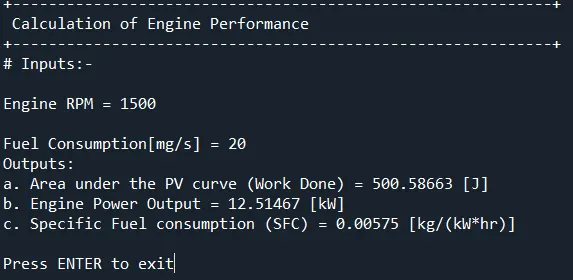
- Calculate the power output of this engine, assuming RPM is 1500.
- Calculate its specific fuel consumption if engine utilizes 20 micrograms of fuel.
3. GOVERNING EQUATIONS:
Area under the PV curve:
The work performed during a thermodynamic process is equivalent to the area under the curve.
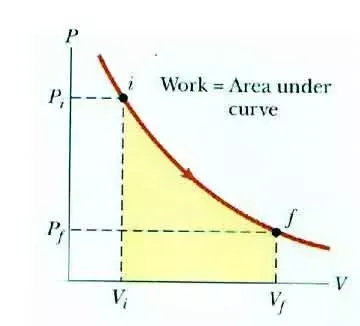
Despite the shape the path takes, the area under the curve will represent the work done. For any curved path, the total could be broken into an infinite amount of rectangles.
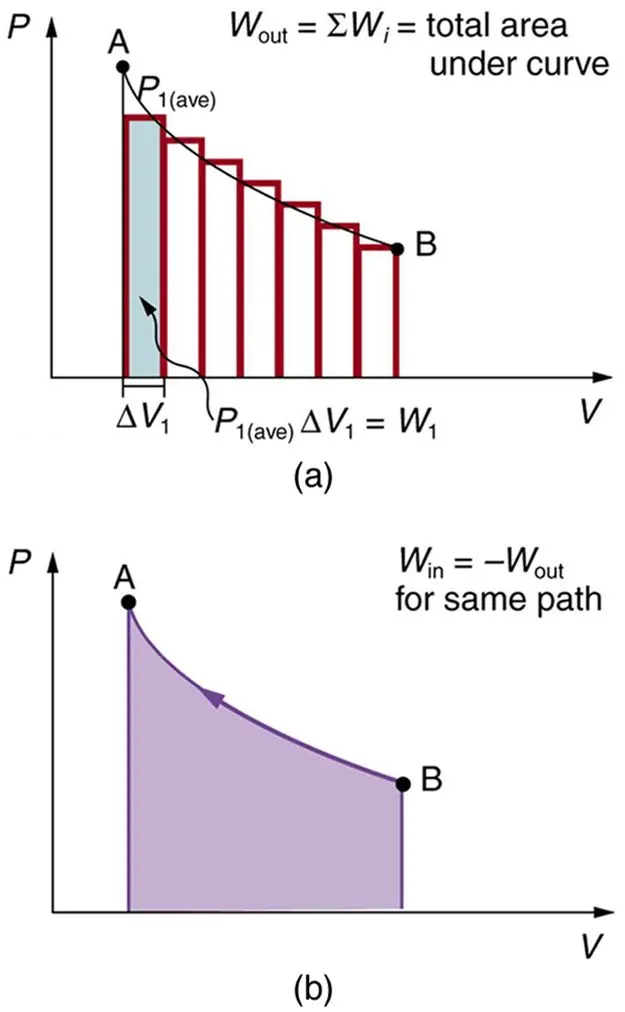
In numerical analysis, the trapezoidal rule is a technique for approximating the definite integral.
Numpy.trapz(y ,x=None, dx=1.0, axis=-1)
Integrate along the given axis using the composite trapezoidal rule.
Integrate y(x) along given axis
Engine Power:
The engine power output could be calculated, based on the following equation.
`Power = W * omega`
Where,
W is the work done.
`omega` is the angular velocity.
Specific Fuel consumption (SFC):
Specific fuel consumption is the rate of fuel consumption divided by the power produce.
`SFC = f_c/P`
4. BODY OF THE CONTENT:
The code developed is the following.
"""File parcing code
By Pablo Jimenez """
print(' ** File Parcing of Engine data ** ')
# Importing libraries in python
import matplotlib.pyplot as plt
import numpy as np

# File Compatibility Check
# For Exception Handling we are going to use try and except
File_name = input("Enter Filename = ")
# Enter list of file names which you want to allow to read
if File_name == ('engine_data.out'):
    P=[] # Empty array to collect property name
    U=[] # Empty array to collect Units
    # ---------- Empty array of Parameters in data file -------- #
    Crank = []
    Pressure = []
    Max_Pres = []
    Min_Pres = []
    Mean_Temp = []
    Max_Temp = []
    Min_Temp = []
    Volume = []
    Mass = []
    Density = []
    Integrated_HR = []
    HR_Rate = []
    C_p = []
    C_v = []
    Gamma = []
    Kin_Visc = []
    Dyn_Visc = []

    line_count = 1
    line_property = 1
    line_Unit = 1

    #Creating for loop to read the data line by line and store that data in empty array
    for line in open(File_name,'r'):
        if '#' in line: # read line in which '#' is present
            if line_property == 3: # read line 3
                P.append(line.split()) # split line 3 and save data in P[] array
            # increment line count to keep track of line number
            line_property = line_property + 1
            if line_Unit == 4: # read line 4
                U.append(line.split()) # split and save data in U[] array
            # increment line count to keep track of line number
            line_Unit = line_Unit + 1
        if '#' not in line: # skip line which have '#' in it
            # Split sata and save column data in their respective array
            Crank.append(float(line.split()[0]))
            Pressure. append(float(line.split()[1]))
            Max_Pres.append(float(line.split()[2]))
            Min_Pres.append(float(line.split()[3]))
            Mean_Temp.append(float(line.split()[4]))
            Max_Temp.append(float(line.split()[5]))
            Min_Temp.append(float(line.split()[6]))
            Volume. append(float(line.split()[7]))
            Mass.append(float(line.split()[8]))
            Density. append(float(line.split()[9]))
            Integrated_HR.append(float(line.split()[10]))
            HR_Rate.append(float(line.split()[11]))
            C_p.append(float(line.split()[12]))
            C_v.append(float(line.split()[13]))
            Gamma. append(float(line.split()[14]))
            Kin_Visc.append(float(line.split()[15]))
            Dyn_Visc.append(float(line.split()[16]))
            # increment line count to keep track of line number
            line_count = line_count + 1

    # Create intput array of the parameters to specify specific Sr No. to it

    INPUT = [0,Crank,Pressure,Max_Pres,Min_Pres,Mean_Temp,Max_Temp,Min_Temp, Volume, Mass, Density, Integrated_HR,HR_Rate,C_p,C_v,Gamma,Kin_Visc,Dyn_Visc]
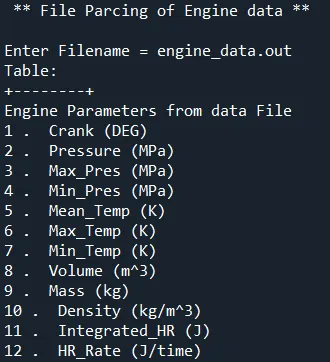
    print('Table:')
    print ('+--------+')
    print('Engine Parameters from data File')
    for x in range(17):
        print(x+1,'. ',P[0][x+1],U[0][x+1])
    print('+-----------------------------------------------------------+')
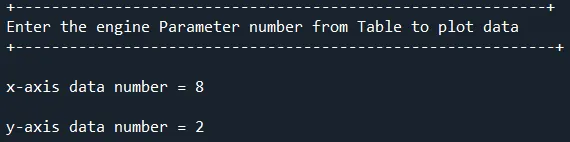
    print('Enter the engine Parameter number from Table to plot data')
    print ('+------------------------------------------------------------+')
    # create inputs for command widow x and y as column number data
    x = input('x-axis data number = ')
    x = int(x)
    y = input('y-axis data number = ')
    y = int(y)

    # Plot figure column vs column y
    fig = plt.figure(linewidth=6, edgecolor="k") # Border and its linewidth for figure window
    plt.plot(INPUT[x],INPUT[y], linewidth=2) # plot column inputs
    plt.xlabel(P[0][x]+U[0][x],size='12' ,weight='bold') # x-axis parameter labeling
    plt.ylabel(P[0][y]+U[0][y],size='12',weight='bold') # y axis parameter labeling

    # Title for the plot
    plt.title(P[0][y]+' Vs '+P[0][x],color='m',size='16',weight='bold')
    plt.grid(color='b',linestyle=':',linewidth='0.5') # grid on
    plt.savefig(P[0][y]+' Vs '+P[0][x]+'.png') # Save the figure as its name
    print('+------------------------------------------------------------+')
    print(' Calculation of Engine Performance')
    print ('+------------------------------------------------------------+')
    print("# Inputs:- ")
    rpm = input('Engine RPM = ')
    rpm = float(rpm)
    fc = input('Fuel Consumption[mg/s] = ')
    fc = float(fc)

    # [1] Area under the PV curve (Work Done)
    Wd = (np.trapz(INPUT[2],INPUT[8]))*(10**6)
    print("Outputs: ")
    print('a. Area under the PV curve (Work Done) = %.5f' %(Wd),'[J]')
    # [2] Engine Power Output [kW]
    p = (Wd*(rpm/60) )/1000
    print('b. Engine Power Output = %.5f'%(p), '[kW]')
    # [3] Specific Fuel consumption (SFC)-(mf/p) [Kh/kW.hr]
    # MassOffuel = fc*3600*10*-6 [kg/hr]
    Sfc = (fc*3600*(10**-6))/p
    print('c. Specific Fuel consumption (SFC) = %.5f'%(Sfc), '[kg/(kW*hr)]' )
    # use of except to print is file name is not in mentioned list
else:
    print('+------------------------------------------------------------- +')
    print("File not Recognized. Please provide a valid CONVERGE output file")
    print ('+---------------------------------------------------------------+')
input('Press ENTER to exit')
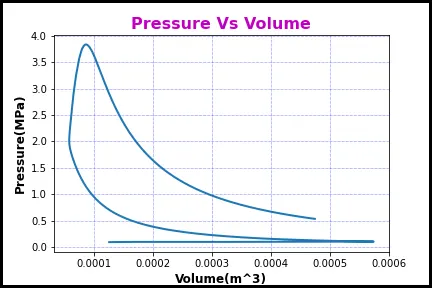
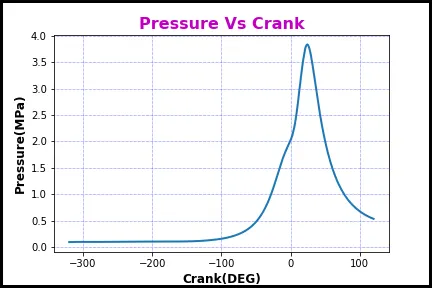
Including the outputs of the program.
Output error message:
5. CONCLUSIONS:
- Data analysis and extraction of data of a file were studied.
- Warning message was elaborated.
- Automatic generation of name and label of picture was achieved.
- Calculation of the area under the curve using numpy library was completed.
- Calculation of the engine power output and specific fuel consumption was accomplished.