Week 6 - Data analysis
Objective: To write a script that can do the following:
- Take column numbers as the input and plot the respective columns as separate images
- Each file should be saved by the name of the column
- The plot labels should be extracted from the file.
Along with that, the code should satisfy the following criteria
Compatibility check
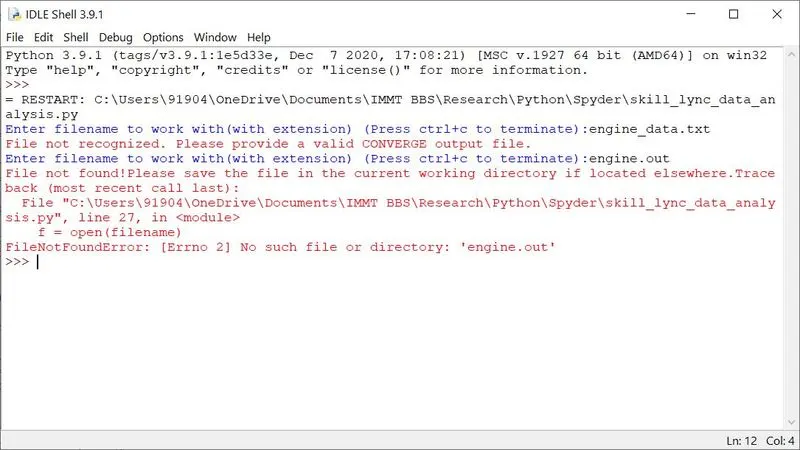
- The code should exit gracefully if a non-compatible file is provided as an input. It should say something like "File not recognized. Please provide a valid CONVERGE output file"
Basic performance calculation
- Calculate the area under the P-V diagram. P is in column 2 and V is in column 8.
- Calculate the power output of this engine. Assume that RPM is 1500
- This engine consumed 20 micrograms of fuel (per 1 stroke cycle). Calculate its specific fuel consumption.
Problem Statement: A script has to be written in python which satisfies the above requirements. The code should be user friendly.
Solution Procedure:
A code was developed in python and has been attached below. The code is explained well using comments as and when required and is self-explanatory.
'''
Data visualizer-CODE BY ANIL DUBEY
'''
import os
import sys
import matplotlib.pyplot as plt
from scipy import integrate

flag = True

#The following loop checks if the file extension is valid
while flag:

    filename = input('Enter filename to work with(with extension) (Press ctrl+c to terminate):')

    if filename.split(sep = '.')[1] == 'out':
        flag = False
    else:
        sys.stderr.write('File not recognized. Please provide a valid CONVERGE output file.\n')#Error message is flagged in case of invalid file type

#The following code checks if the file exists in the working directory or not
if os.path.exists(filename):
    pass
else:
    sys.stderr.write('File not found!Please save the file in the current working directory if located elsewhere.')

f = open(filename)
f.readline()
column_no = f.readline()
column_names = f.readline()
units = f.readline()
f.readline()

#Saving the column numbers, labels and units for axis labelling in plots
column_no = column_no.split()
column_names = column_names.split()
units = units.split()

#Removing unnecessary elements from the list using pop() method
garb = column_no.pop(0)
garb = column_no.pop(0)
garb = column_names.pop(0)
garb = units.pop(0)

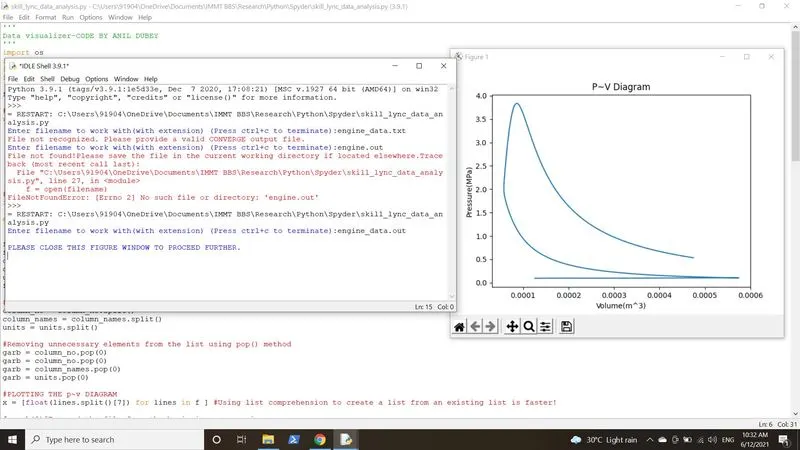
#PLOTTING THE p~v DIAGRAM
x = [float(lines.split()[7]) for lines in f ] #Using list comprehension to create a list from an existing list is faster!

f.seek(0)#To read the file from the beginning once again

for i in range(5):#For Skipping the unnessary lines at the beginning of the file
    f.readline()

y = [float(lines.split()[1]) for lines in f ]

plt.plot(x,y)
plt.xlabel(column_names[7]+units[7])
plt.ylabel(column_names[1]+units[1])
plt.title('P~V Diagram')
print()
print('PLEASE CLOSE THIS FIGURE WINDOW TO PROCEED FURTHER.')
plt.savefig('Engine'+column_names[7]+'_'+column_names[1]+'.jpeg',dpi=600)#Saving the figure
plt.show()
print()
print('Figure saved as:'+'Engine'+'_'+column_names[1]+column_names[7]+'.jpeg'+' in the current folder.')


#Calculating the area under the P~V Diagram through numerical integration
result = integrate.trapezoid(y, x)
print()
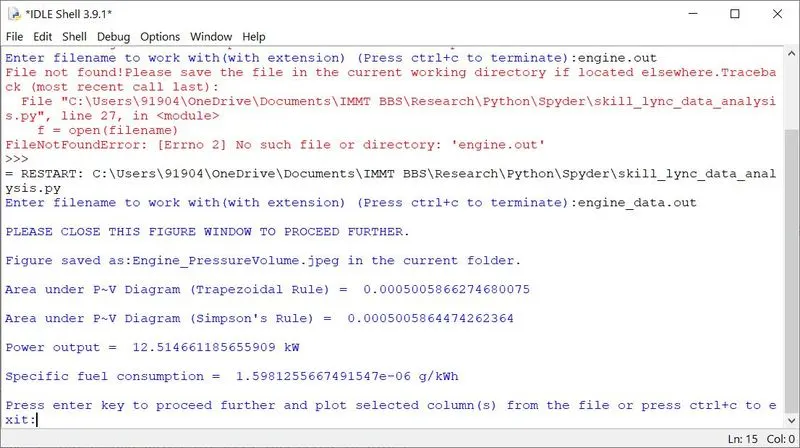
print('Area under P~V Diagram (Trapezoidal Rule) = ',result)
result = integrate.simps(y, x)
print()
print('Area under P~V Diagram (Simpson\'s Rule) = ',result)


#POWER and SFC calculation
print()
power = result*(10**3)*1500/60
print('Power output = ',power,'kW')
print()
sfc = 20*pow(10,-6)/power
print('Specific fuel consumption = ',sfc,'g/kWh')
print()
response = input('Press enter key to proceed further and plot selected column(s) from the file or press ctrl+c to exit:')

#Taking user input for plotting other graphs using while loop
flag = True
while flag:
    #The following portion of the code displays the column numbers with respective labels for the user
    print()
    print('COLUMN NUMBERS AND RESPECTIVE LABELS:')
    print()
    print('COLUMN NO    COLUMN LABEL   UNIT')
    print('-'*35)
    for i in range(len(column_no)):
        print('%-13s%-15s%-s'%(column_no[i],column_names[i],units[i]))

    print()

    #Taking user input as column numbers
    c_numx = int(input('Enter the column number for x axis (Please enter 0 if no data required along x axis):'))
    c_numy = int(input('Enter the column number for y axis:'))

    if c_numx:
        f.seek(0)
        for i in range(5):
            f.readline()
        x = [float(lines.split()[c_numx-1]) for lines in f ]

    f.seek(0)
    for i in range(5):
        f.readline()

    y = [float(lines.split()[c_numy-1]) for lines in f ]

    if c_numx:
        plt.plot(x,y)
        plt.xlabel(column_names[c_numx-1]+ units[c_numx-1])
        plt.ylabel(column_names[c_numy-1]+ units[c_numy-1])
        print('PLEASE CLOSE THIS FIGURE WINDOW TO PROCEED FURTHER.')
        plt.savefig('Engine'+column_names[c_numx-1]+'_'+column_names[c_numy-1]+'.jpeg',dpi=600)
        plt.show()
        print()
        print('Figure saved as:'+'Engine'+'_'+column_names[c_numy-1]+'_'+column_names[c_numx-1]+'.jpeg'+' in the current folder.')
    else:
        plt.plot(y)
        plt.ylabel(column_names[c_numy-1]+units[c_numy-1])
        print('PLEASE CLOSE THIS FIGURE WINDOW TO PROCEED FURTHER.')
        plt.savefig('Engine'+'_'+column_names[c_numy-1]+'.jpeg',dpi=600)
        plt.show()
        print()
        print('Figure saved as:'+'Engine'+'_'+column_names[c_numy-1]+'.jpeg'+' in the current folder.')

    print()


    response = input('Do you want to plot more? (Y/N):')
    if (response == 'Y' or response == 'y'):
        flag = True
    if (response == 'N' or response == 'n'):
        flag = False

f.close()#Closing the file
PLOTS AND SCREENSHOTS:
1. Checking for the file type and file name
2. Plotting P~V Diagram
3. Area, power and SFC calculation:
Results and Discussion: The present code satisfies all the requirements as specified in the challenge.