Week 6 - Data analysis
- AIM: To perform the data analysis of a given data by programming in Python
Theoritical Background:
Data analysis plays a role in making decisions more scientific and helping businesses operate more effectively. Data analysis is a
process of inspecting, cleansing, transforming and modeling data with the goal of discovering useful information, informing
conclusions and supporting decision-making. Data analysis has multiple facets and approaches, encompassing diverse
techniques under a variety of names, and is used in different business, science, and social science domains.
Analysis refers to breaking a whole into its separate components for individual examination. Data analysis is a process for
obtaining raw data and converting it into information useful for decision-making by users. Data is collected and analyzed to
answer questions, test hypotheses.
The four types of data analysis are: - Descriptive Analysis.
- Diagnostic Analysis.
- Predictive Analysis.
- Prescriptive Analysis.
The data file given consist of various parameters of an engine. We have to calculate the below parameters
- Work done by the engine is obtained by calculating the area under the P-V diagram
- Power output of the engine is given as below
n - Number of cylinders of engine, RPM - engine speed in minutes,W - Work output by the engine - Specific Fuel Consumption(SFC)
- SFC = mass of fuel consumption / Engine brake power = FC / P

PROCEDURE:
- Import the modules such as Math, matplotlib, numpy,scipy for performing their respective functions
- For the purpose of plotting the curves between 2 quantities as per the user input, a line counter is initiated from 1. Now an "if"
loop is iterated with the condition if '#' not in line all the numerical values present in the data file is now to be stored in the data
array as string. Now another "if" loop is executed with the conditon that line counter greater than or equal to 6 all the data will
be stored in the pressure and volume array respectively. - For Engine performance calculations, the area under the PV diagram has to be calculated and we are using Simpson method
for calculating it. - Two arrays of name of parameters and their units are made as per the data file given and then the user has to choose from
them to plot respective graphs. For this 2 inputs of the user are taken using the input command and data type is set as 'int'. The
user is entering column number as input and results are generated.
Programming in Python:
import matplotlib.pyplot as plt
import math
import numpy as np
from scipy.integrate import simps

#Compatibility check
def file_reader(fname):
	if fname == "engine_data.out":
		print("File Name OK","n","Proceeding Compatibility Check")
		if 'CONVERGE' not in a[0]:
			print("Error : Unsupported File")
			print("Provide a Valid Converge File")
			exit()
		else:
			print("File is compatable. Set up OK!!")
	else:
		print("Error : Unsupported File")
		print("Provide a Valid Converge File")
		exit()

loop = 1

fname = input("Enter the filename:-")
print('\n')

a = []
for line in open(fname,'r'):
	if '#' in line:
		a.append(line.split())
file_reader(fname)
line_count = 1

try:
	data = open(fname,"r")
except FileNotFoundError:
	print('"File not recognized. Please provide a valid output file"')
	exit()


while loop == 1:
	parameter = ['Crank Angle','Pressure','Maximum Pressure','Minimum Pressure','Mean Temperature','Maximum Temperature','Minimum Temperature','Volume','Mass','Density','Heat Rejection', 'Rate','C_p','C_v','gamma','Kinematic Viscosity','Dynamic Viscosity']

	#print(parameter)
	print('\n')
	print('Followings are the codes for corresponding parameters,Please follow the Instructions')
	print('\n')
	print('  \n 1 Crank  \n 2 Pressure  \n 3 Maximum Pressure  \n 4 Minimum Pressure  \n 5 Mean Temperature  \n 6 MaximumTemperature  \n 7 Minimum Temperature  \n 8 Volume  \n 9 Mass  \n 10 Density  \n 11 Integrated HR  \n 12 HR rate  \n 13 Cp  \n 14 Cv  \n 15 gamma  \n 16 Kinematic Viscosity  \n 17 Dynamic Viscosity')
	print('\n')
	first_column=input('Enter the first column:')
	second_column=input('Enter the second column:')
	print('\n')

	first_column=int(first_column)
	second_column=int(second_column)

	values_of_column_1=[]
	values_of_column_2=[]

	for line in open(fname):

		if'#' not in line:
			values_of_column_1.append(float(line.split()[first_column-1]))
			values_of_column_2.append(float(line.split()[second_column-1]))
			line_count += 1

	plt.figure(1)
	plt.plot(values_of_column_2,values_of_column_1 ,linewidth=3,color='red')
	plt.xlabel(parameter[second_column-1],color='green',fontsize=12)
	plt.ylabel(parameter[first_column-1],color='green',fontsize=12)
	plt.title(parameter[first_column-1]+' VS '+parameter[second_column-1],color='b',fontsize=15)
	plt.savefig(parameter[first_column-1]+'VS'+parameter[second_column-1]+'.png')
	plt.grid()
	plt.show()


# Presure and Volume plot
	values_of_column_3=[]
	values_of_column_4=[]
	for line in open(fname):

		if'#' not in line:
			values_of_column_3.append(float(line.split()[1]))
			values_of_column_4.append(float(line.split()[7]))
			line_count += 1

	area = float(simps(values_of_column_3, values_of_column_4))
	print('area:{}\n'.format(area))

	rpm=1500
	speed=rpm/60
	power=area*speed
	print('power:{}\n'.format(power))

	mass_of_fuel = 20*pow(10,-6)
	specific_fuel_consumption=mass_of_fuel/power
	print('specific_fuel_consumption: {}\n'.format(specific_fuel_consumption))

	plt.figure(2)
	plt.plot(values_of_column_4,values_of_column_3 ,linewidth=3,color='red')
	plt.xlabel(parameter[7],color='green',fontsize=12)
	plt.ylabel(parameter[1],color='green',fontsize=12)
	plt.title(parameter[1]+' VS '+parameter[7],color='b',fontsize=15)
	plt.savefig(parameter[1]+'VS'+parameter[7]+'.png')
	plt.show()

	loop = int(input("Do you want to continue for another data or exit?  \n Enter 1 to Continue  \n Enter 0 to exit \n GIVE INPUT:"))
print(" \n \n")
print("*****************************************EXITING PROGRAM!!******************************************")
exit()
RESULT & PLOTS
- Run the build
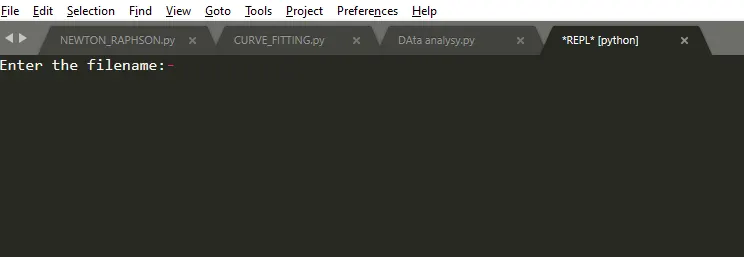
- Put the Valid file name
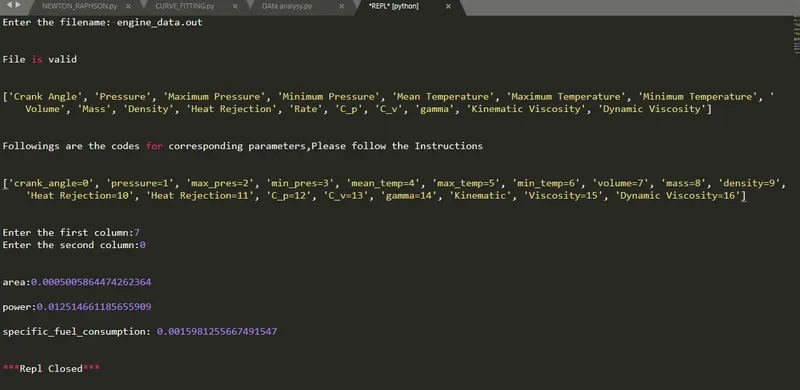
- Enter the value of coresponding value to plot
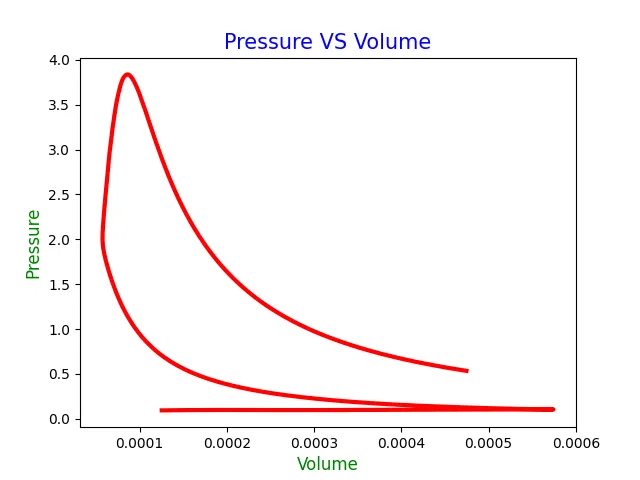
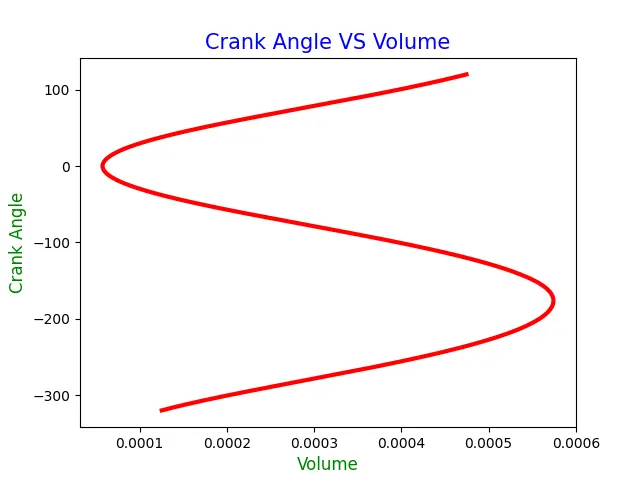
Results Explanation
- Area under the p-v diagram i.e, Work Done : 500.58662746800763 J
- Power: 12.51466568670019 KW
- Specific Fuel Consumption: 5.753249971073308e-06 gm/KWhr
- These are the outputs for the input of Pressure and Volume.
Conclusion
Hence , the data analysis was done and the all the questions were answered