Data Analysis
Objective: -
The objective is to develop a code in python for analysis of the data of the file name engine_data.out
- To take the input of file from the user and input of the axis of the plot
- To check the compatibility of the file and check the file
- Each file should be saved by the name of the column
- To calculate the area under the P-V diagram.
- To calculate the power output of this engine.
- to calculate its specific fuel consumption.
Problem statement: -
- The plot labels should be extracted from the file. If I request for a plot between column 1 (crank angle) and column 8(volume), then the label information should automatically be extracted and must appear as labels in the plots. THIS SHOULD NOT BE DONE MANUALLY
- Compatibility check
- To attach the plot between any of the two column values
- Screenshot of Comptability check screenshot and performance value screenshot
Principle: -
Data analysis is a process of inspecting,cleaning, trnsforming, and modelling data with the goal of discovering useful information, informing conclusions, and supporting decision-making. Data analysis has multiple facets and approaches, encompassing diverse techniques under a variety of names, and is used in different business, science, and social science domains. In today's business world, data analysis plays a role in making decisions more scientific and helping businesses operate more effectively.
There are several types of Data Analysis techniques that exist based on business and technology. However, the major Data Analysis methods are:
- Text Analysis
- Statistical Analysis
- Diagnostic Analysis
- Predictive Analysis
- Prescriptive Analysis
Data Analysis consists of the following phases:
- Data Requirement Gathering
- Data Collection
- Data Cleaning
- Data Analysis
- Data Interpretation
- Data Visualization
Data visualization: -
Data visualization is very common in your day to day life; they often appear in the form of charts and graphs. In other words, data shown graphically so that it will be easier for the human brain to understand and process it. Data visualization often used to discover unknown facts and trends. By observing relationships and comparing datasets, you can find a way to find out meaningful information.
Perks of data analysis: -
- It detects and correct the errors from data sets with the help of data cleansing. This helps in improving quality of data and consecutively benefits both customers and institutions such as banks, insurance and finance companies.
- It removes duplicate informations from data sets and hence saves large amount of memory space. This decreases cost to the company.
- It helps in displaying relevant advertisements on the online shopping websites based on historic data and purchase behaviour of the users. Machine learning algorithms are applied for the same. This helps in increasing revenue and productivity of the companies.
- It reduces banking risks by identifying probable fraudulent customers based on historic data analysis. This helps institutes in deciding whether to issue loan or credit cards to the applicants or not.
- It is used by security agencies for surveillane and monitoring purpose based on informations collected by huge number of sensors. This helps in preventing any wrongdoings and/or calamities.
Solution procedure: -
The development of a code to perform data analysis on a file.
Step 1: Extract the data from the file by opening the file using the open keyword
Step 2: Extract the data of the Column ,names of the parameters of the engine nd thiers units
Step 3: Display the parameters column number and units in vertical format in output window
Step 4: Take input from the user for the x_axis and y_axis of the plot
Step 5: Extract the data for the different parameters ie pressure ,volume or temperature etc.
Step 6: Plot the graph between the user defined parameters for the x and y axis for the plot
Step 7: Then save the generated plot by the names of the parameters
Step 8: Then calculate the area under the curve for the Pressure vs Volume plot using both the methods by Trapz and Simpsons rule
Step 9: Calculating the Power output of the engine and printing it in the output window
Step 10: Calculating the Specific fuel consumption and printing it
________________________________________________________________________________________________________
CODE for the Data Analysis: -
"""
File Parsing using Python
"""
#intializing module
import math
import numpy as np
from scipy.integrate import simps
from numpy import trapz
import matplotlib.pyplot as plt

#User inputs to check the filename

File_name = input('Enter the file name to be searched ')

#Checking file is present or not

if File_name =='engine_data.out':
	print('File is present','n')
else:
	print('File not recognized. Please provide a valid CONVERGE output file')
	File_name = input('Enter the file name to be searched ')
#____________________________________________________________________________________file check

#basic initialization of the array

# crank ,pressure,volume,temperature array
crank=[]
temperature=[]
pressure=[]
volume = []
#para array to store the all the data as parameter name column number and units
para = []

names =[]

column=[]
units = []
for line in open(File_name):

	if '#' in line:
		para.append(line.split())

#to store the length of the column line

l_colm =len(para[1])
# r store the index number of the keyword column
r =para[1].index('column')

for i in range(r,l_colm-1):
	column.append(i)

for j in para[2]:

	if j != '#':
		names.append(j)

for k in para[3]:

	if k != '#':
		units.append(k)


#Printing the parameter in the vertical format

print(' ','S.No','      ','Engine data with units','n')  #parameter original names with coloumn

#printing the column names with the parameters and its unit
for i in range(0,l_colm-2):
	print('  ',column[i],'         ',names[i],units[i],'n')

################################################################################################end of first part

data_xaxis =[]
data_yaxis = []
#Taking inputs from the user

x= int(input("Enter the x-axis for the plot = "))
y= int(input("Enter the y-axis for the plot = "))
print('n')

#As the indexing starts from 0 we do: -
x = x -1 #according to th indexing
y = y- 1


#file parsing starts here
for line in open(File_name):

	if '#' not in line:
		data_xaxis.append(float(line.split()[x]))
		data_yaxis.append(float(line.split()[y]))

		#Data input from the user is updated in the assigned data array
		crank.append(float(line.split()[0]))
		pressure.append(float(line.split()[1]))
		temperature.append(float(line.split()[4]))
		volume.append(float(line.split()[7]))

print('The plot for the ',names[x],' vs ',names[y],' is shown as output','n')
#plotting according to the user
plt.xlabel(names[x])
plt.ylabel(names[y])
plt.title(names[x]+' '+'vs'+' '+names[y])
plt.plot(data_xaxis,data_yaxis,linewidth =3)
plt.savefig(names[x]+' vs '+names[y])
plt.show()


#calculating for the

#converting the pressure into the pascal
Pressure = pow(10,6)*np.array(pressure)

Volume =np.array(volume)

#calculating Area under the curve
#Computing the area using the composite trapezoidal rule
area_Trapezoidal_rule = trapz(Pressure,Volume)
print('Area under the curve is = ',area_Trapezoidal_rule,' joule')

#Calculating the area using Simpon's rule

area_Simpons_rule =simps(Pressure,Volume)
print('Area under the curve is = ',area_Simpons_rule,'joule','n')


#Power calculation
power = (area_Simpons_rule*(1500/60))/1000
print('Power of the Engine is = ',power,' KW','n')

#Specific Fule Consumption calculation
fuel_sc = (20*pow(10,-6)*3600)/power
print("Specific Fule Consumption is = ",fuel_sc,' g/KWh')
Explanation of the above code: -
"""
File Parsing using Python - comments to make a program user friendly
"""
- #intializing module - comments
- import math - importing the mth class
- import numpy as np - importing the numpy to perform numeric calculation
- from scipy.integrate import simps - importing simps to calculate area of the curve
- from numpy import trapz - importing to calculate the area
- import matplotlib.pyplot as plt - importing to plot the data
#User inputs to check file name
- File_name = input('Enter the file name to be searched ') - to input the file name from the user
#Checking file is present or not -comments
- if File_name =='engine_data.out':- checking the file exist or not by using if statement
- print('File is present','n') - to print that file is present
- else: - else statement to execute other statement
- print('File not recognized. Please provide a valid CONVERGE output file') - print if the file name is not found
- File_name = input('Enter the file name to be searched ') - again take output from user after executing else statement
#____________________________________________________________________________________file check
#basic intializtion of the array
- # crank ,pressure,volume,temperature array - comments
- crank=[] - to store the data from the file in crank array
- temperature=[] - to store the data from the file in temperature array
- pressure=[] - to store the data from the file in pressure array
- volume = [] - to store the data from the file in volume array
#para array to store the all the data as parameter name column number and units - para = [] - to store the data having # in the line
- names =[] - to store the engine parameter name in the array
- column=[] - to store the the column number extracted in para array in the column array
- units = [] - to store the the units name extracted in para array in the units array
- for line in open(File_name): - for loop to open the file
- if '#' in line: - to check if ' #' is present in the line
- para.append(line.split()) - appending the line having ' #' in the para array
#to store the length of the column line
- l_colm =len(para[1]) - to store the length of the first line extrced in para array
# r store the index number of the keyword column - r =para[1].index('column') - r store the index number of the keyword column
- for i in range(r,l_colm-1): - o run a for loop between column index till the length of column -1
- column.append(i) - append the column number in column array
- for j in para[2]: -to run a for lop nd check j in line 2 store inpara array containing parameter names
- if j != '#': -checking if '#' is no present the line 2
- names.append(j) - append the parameter names in the names array
- for k in para[3]: - to run a for loop for line 3 of para to check the units name
- if k != '#': - checking if '#' is no present the line 2
- units.append(k) - append the units name int the units array
#Printing the parameter in the vertical format
- print(' ','S.No',' ','Engine data with units','n') - print the statements
- #parameter original names with coloumn
- #printing the column names with the parameters and its unit
- for i in range(0,l_colm-2): - to run a loop for range 0 index to length of column-2
- print(' ',column[i],' ',names[i],units[i],'n')- print the data in vertical format
- data_xaxis =[] - to initialize an array to store the data input of x axis by the user
- data_yaxis = [] - to initialize an array to store the data input of y axis by the user
#Taking inputs from the user - x= int(input("Enter the x-axis for the plot = ")) - to take the input from the user for the column number for x axis displayed above code
- y= int(input("Enter the y-axis for the plot = "))- to take the input from the user for the column number for y axis displayed above code
- print('n') - to print a blank line
- #As the indexing starts from 0 we do: -comments
- x = x -1 #according to th indexing
- y = y- 1
#file parsing starts here- for line in open(File_name):- to open the file
- if '#' not in line: - check if '#' is present in line or not
- data_xaxis.append(float(line.split()[x])) - to append the data in data_xaxis from the column number inputted by the user
- data_yaxis.append(float(line.split()[y]))- to append the data in data_yaxis from the column number inputted by the user
- #Data input from the user is updated in the assigned data array - comments
- crank.append(float(line.split()[0])) - to append the crank column data in crank array
- pressure.append(float(line.split()[1])) - to append the pressure column data in pressure array
- temperature.append(float(line.split()[4])) - to append the temperature column data in temperature array
- volume.append(float(line.split()[7])) - to append the volume column data in volume array
- print('The plot for the ',names[x],' vs ',names[y],' is shown as output','n')- to print statement
#plotting according to the user - plt.xlabel(names[x]) - labelling the x axis inputted by the user
- plt.ylabel(names[y])- labelling the y is inputted by the user
- plt.title(names[x]+' '+'vs'+' '+names[y]) - to generate the title for the plot according to the user
- plt.plot(data_xaxis,data_yaxis,linewidth =3) - to plot graph selected by the user
- plt.savefig(names[x]+' vs '+names[y]) - to save the plot generated
- plt.show() - to show the plot in output window
#calculating for the
- #converting the pressure into pascal
- Pressure = pow(10,6)*np.array(pressure) - to convert the pressure value in pressure array into pascal
- Volume =np.array(volume) - to store the volume array generated
- #calculating Area under the curve
#Computing the area using the composite trapezoidal rule- area_Trapezoidal_rule = trapz(Pressure,Volume) - to calculate area
- print('Area under the curve is = ',area_Trapezoidal_rule,' joule')
#Calculating the area using the Simpon's rule
- area_Simpons_rule =simps(Pressure,Volume)
- print('Area under the curve is = ',area_Simpons_rule,'joule','n')
#Power calculation
- power = (area_Simpons_rule*(1500/60))/1000 - to calculate the power output of the engine
- print('Power of the Engine is = ',power,' KW','n') - print on the output screen
#Specific Fule Consumption calculation
- fuel_sc = (20*pow(10,-6)*3600)/power to calculate the specific fuel consumption of the engine
- print("Specific Fule Consumption is = ",fuel_sc,' g/KWh') - to print it
Output:-
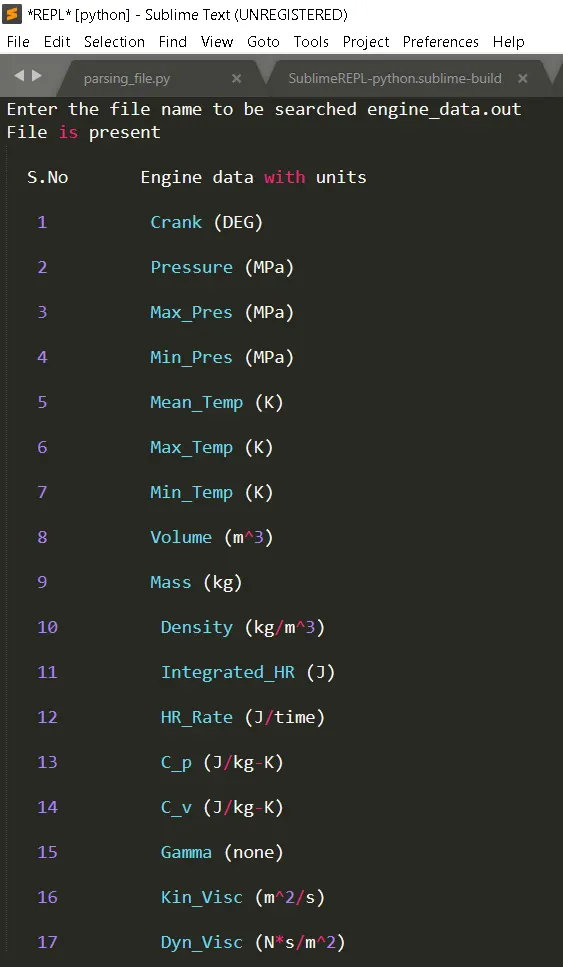
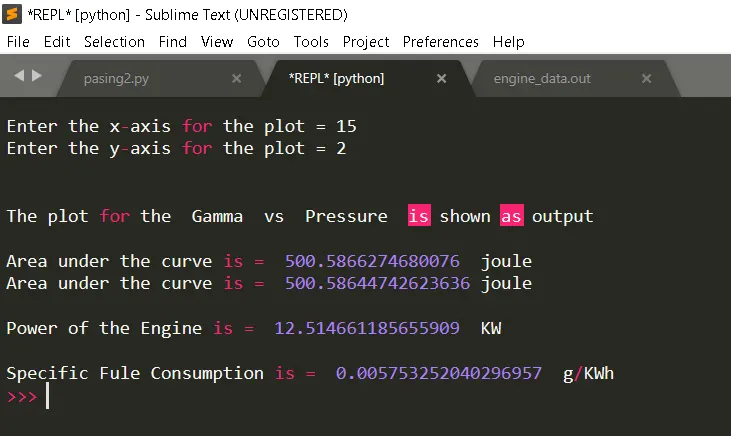
Plot generated saved by the code in png format
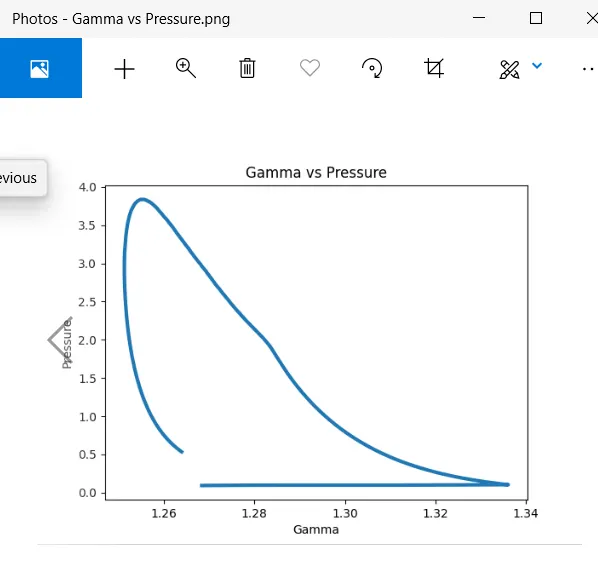
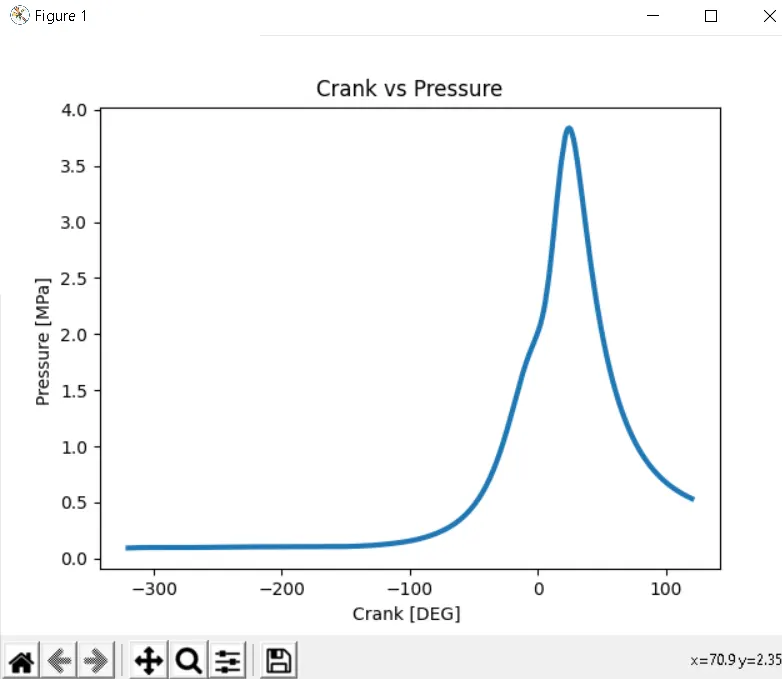
Plot for different parameters: -
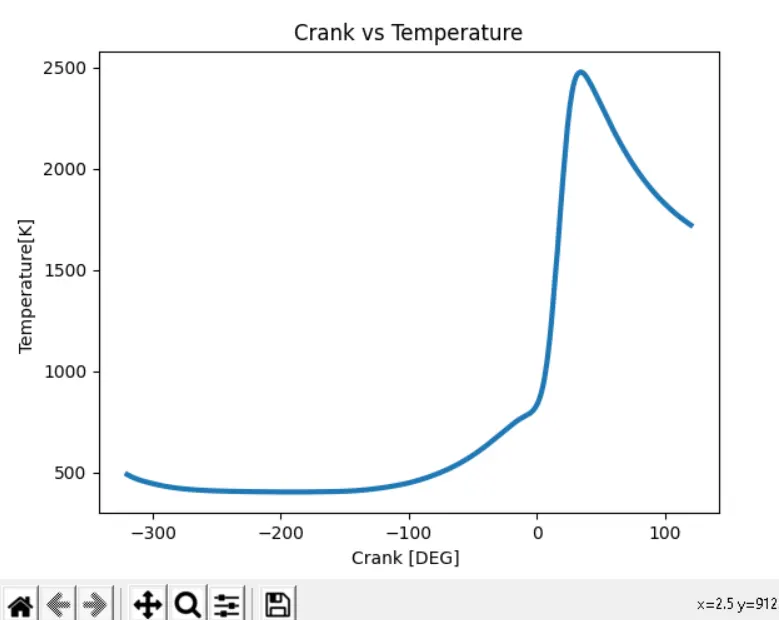
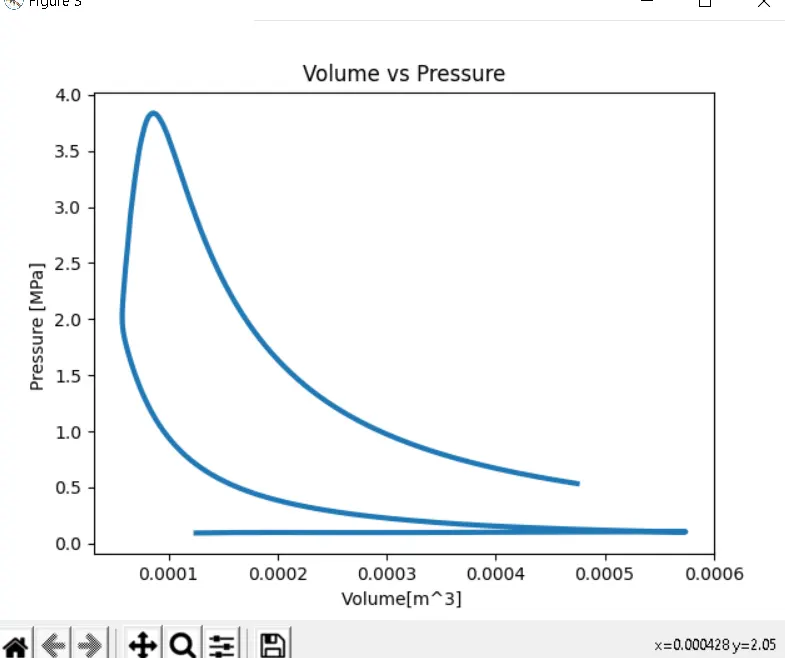
________________________________________________________________________________________________________
Errors faced during programming: -
- An error was generated due to not defining the proper name for the value assigned
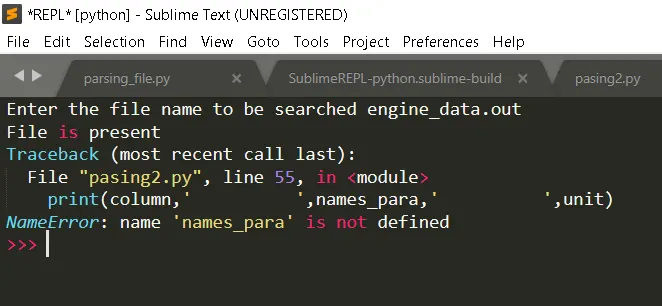
- Error arrived due to the wrong indentation in the code
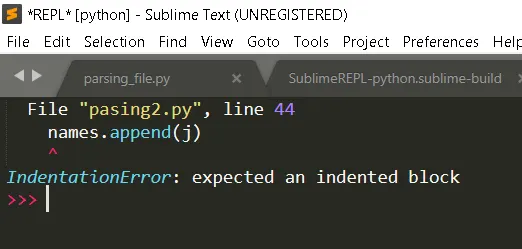
- Error is due to as the column array was not initialized
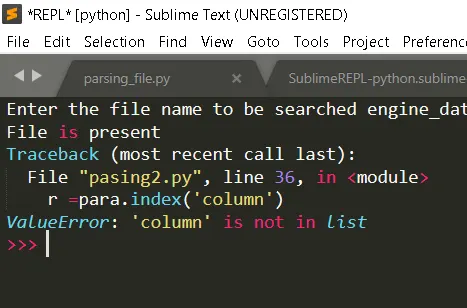
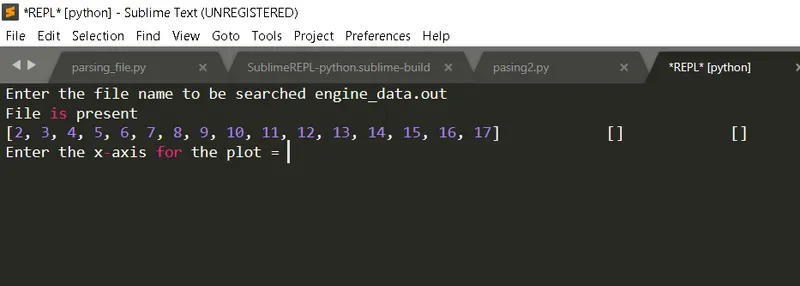
- No data was being printed in the array of names and it was found on debugging due to the wrong logic in the code
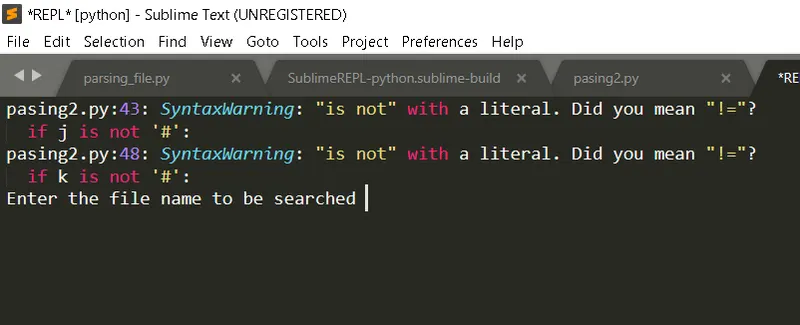
- An error was caused because use of is not instead of ! =
- Error arrived due to the typo error
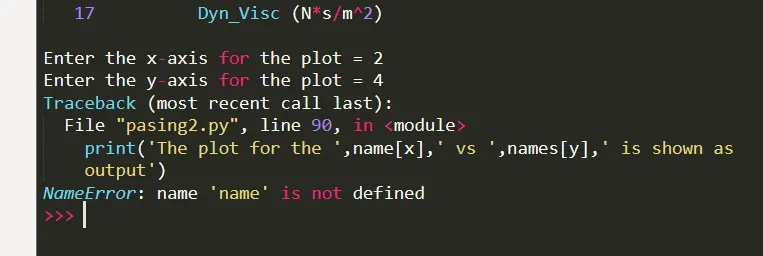
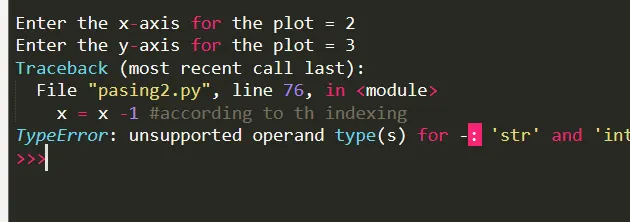
- The error was caused as the input was taken in string format on debugging the code it was found that int was o be used
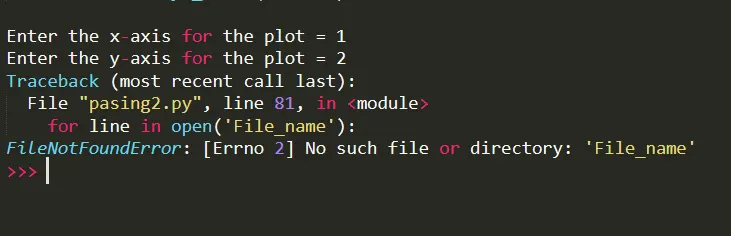
- An error was due to s the file name was inputted in within inverted commas
Result and Discussion: -
- The area under the curve using Trapz rule is = 500.5866274680076 joule
- The area under the curve using Simpson's rule is = 500.58644742623636 joule
- The power output of the Engine is = 12.514661185655909 KW
- Specific Fule Consumption is = 0.005753252040296957 g/KWh
References: -
https://www.rfwireless-world.com/Terminology/Advantages-and-Disadvantages-of-Data-Analytics.html
https://www.teradata.com/Blogs/5-Big-Benefits-of-Data-and-Analytics-for-Positive-Business-Outcomes
https://www.guru99.com/what-is-data-analysis.html#4
https://www.geeksforgeeks.org/matplotlib-pyplot-savefig-in-python/