Data analysis of 'Engine data' from Converge data file using Python
Objective:
- To analyse a given engine data and parse the required information from the CONVERGE output data file.
- To take column numbers as input and plot the graph between the column data.
- To plot the labels on the graph with respect to their column name.
- From the analysed data calculate the work done by the engine,power output of the engine and specific fuel consumption of the engine.
What is Data analysis?
Data analysis is a process of inspecting, cleansing, transforming, and modeling data to discover useful information, informing conclusions, and supporting decision-making. Data analysis has multiple facets and approaches, encompassing diverse techniques under a variety of names, and is used in different business, science, and social science domains. In today's business world, data analysis plays a role in making decisions more scientific and helping businesses operate more effectively.
Data mining is a particular data analysis technique that focuses on statistical modeling and knowledge discovery for predictive rather than purely descriptive purposes, while business intelligence covers data analysis that relies heavily on aggregation, focusing mainly on business information. In statistical applications, data analysis can be divided into descriptive statistics, exploratory data analysis (EDA), and confirmatory data analysis (CDA). EDA focuses on discovering new features in the data while CDA focuses on confirming or falsifying existing hypotheses. Predictive analytics focuses on the application of statistical models for predictive forecasting or classification, while text analytics applies statistical, linguistic, and structural techniques to extract and classify information from textual sources, a species of unstructured data. All of the above are varieties of data analysis.
Data integration is a precursor to data analysis, and data analysis is closely linked to data visualization and data dissemination.
Procedure involved in analysing the 'engine_data.out' file:
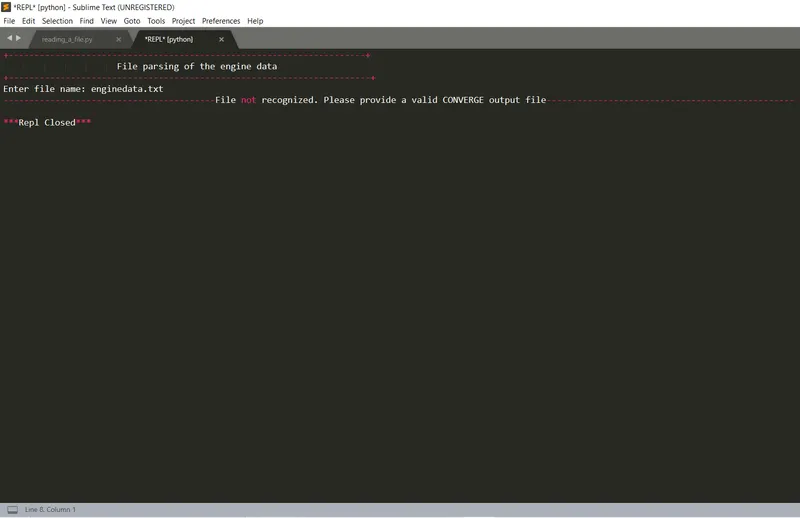
In this file we first need to input the valid file name which we need to parse or analyse.If the file name is not valid we need to show on the screen "File not recognized. Please provide a valid CONVERGE output file".
After this step we need print out all the engine parameters that are involved in the data file and tabulate them serial-wise.
After tabulating the engine parameters we need create some codes to take the input for the column numbers so that the plot is generated between the two columns.
When the plot is genereated it should be saved into the system.
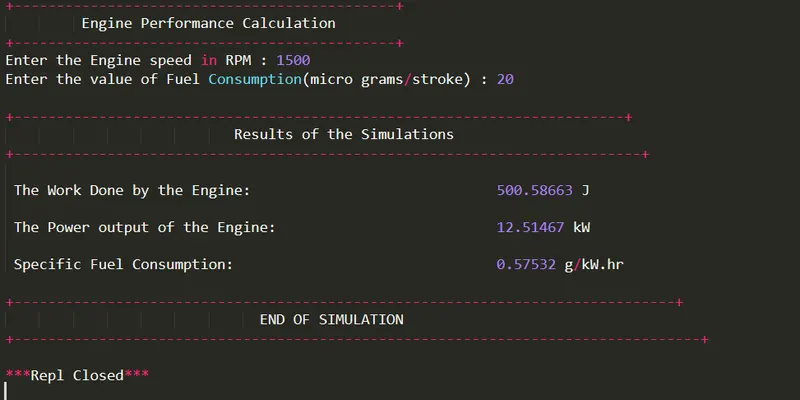
Now the engine performance is calculated in which the work done by the engine is calculated first ,then the power output of the engine and then the specific fuel consumption is calculated after that.
Pyhton code:
import math
import matplotlib.pyplot as plt
import numpy as np
from prettytable import PrettyTable
from scipy import integrate

"""
Demonstrating the file parsing for a given data
"""
print('+---------------------------------------------------------------------+')
print('                      File parsing of the engine data                   ')
print('+----------------------------------------------------------------------+')


f = input("Enter file name: ")
if f == ('engine_data.out'):
	f = open('engine_data.out')
	lines = f.readline()
	lines = f.readline()
	lines = f.readline()
     # Empty Arrays of the engine parameters
	column_name = lines.split()

	lines = f.readline()

	units = lines.split()
	nan = []
	crank = []
	pressure = []
	max_pressure = []
	min_pressure = []
	mean_temp = []
	max_temp = []
	min_temp = []
	volume = []
	mass = []
	density = []
	integrated_HR = []
	HR_rate = []
	cp = []
	cv = []
	gamma = []
	kin_visc = []
	dyn_visc = []


	# Table for storing all the variables
	print('+--------------------------------------------------------------------------------------+')
	print('                           List of Engine parameters from data file                     ')
	print('+--------------------------------------------------------------------------------------+')
	table = PrettyTable(['Sr.no.','Engine Parameters'])


	for i in range(1,len(column_name)):
		table.add_row([i,column_name[i]+units[i]])
	print(table)

	line_count = 1
	for line in f:

		if '#' not in line:
			crank.append(float(line.split()[0]))
			pressure.append(float(line.split()[1]))
			max_pressure.append(float(line.split()[2]))
			min_pressure.append(float(line.split()[3]))
			mean_temp.append(float(line.split()[4]))
			max_temp.append(float(line.split()[5]))
			min_temp.append(float(line.split()[6]))
			volume.append(float(line.split()[7]))
			mass.append(float(line.split()[8]))
			density.append(float(line.split()[9]))
			integrated_HR.append(float(line.split()[10]))
			HR_rate.append(float(line.split()[11]))
			cp.append(float(line.split()[12]))
			cv.append(float(line.split()[13]))
			gamma.append(float(line.split()[14]))
			kin_visc.append(float(line.split()[15]))
			dyn_visc.append(float(line.split()[16]))
			line_count = line_count + 1


	column_data = [nan,crank,pressure,max_pressure,min_pressure,mean_temp,max_temp,min_temp,volume,mass,density,integrated_HR,HR_rate,cp,cv,gamma,kin_visc,dyn_visc]

	print('+---------------------------------------------------------------+')
	print('    Enter the column number from the table to plot the data      ')
	print('+---------------------------------------------------------------+')

	x = int(input("Enter the column number for x axis: "))
	y = int(input("Enter the column number for y axis: "))

	# plotting the result


	plt.plot(column_data[x],column_data[y],color = 'r',linewidth = 3)
	plt.xlabel(column_name[x] + units[x],color = 'g',size = '15')
	plt.ylabel(column_name[y] + units[y],color = 'g',size = '15')
	plt.title(column_name[y]+  ' Vs '  +column_name[x],color = 'b',size = '15')
	plt.show()

	# Engine Performance Calculation
	print('+---------------------------------------------+')
	print('         Engine Performance Calculation   ')
	print('+---------------------------------------------+')

	# Inputs
	rpm = float(input("Enter the Engine speed in RPM : "))
	fc = float(input("Enter the value of Fuel Consumption(micro grams/stroke) : "))


	# Calculating Area under the PV curve
	work_done = np.trapz(column_data[2],column_data[8])
	work_done = work_done * pow(10,6)

	# Calculating the Power output of the engine. P = Wd * engine speed
	rps = rpm/60  # Converting rpm into rotation per seconds (rps)
	p = work_done * rps # Power output in watts
	p = p/1000  # Power output in kilowatts (kW)

	# Calculating the Specific fuel consumption
	m_fc = fc * 3600 * pow(10,-6) * 4 * rps # mass of the fuel in kg/hr
	sfc = m_fc/p

	print('n+------------------------------------------------------------------------+')
	print('                           Results of the Simulations                       ')
	print('+--------------------------------------------------------------------------+')

	print('n The Work Done by the Engine:                             %0.5f'%(work_done),'J')
	print('n The Power output of the Engine:                          %0.5f'%(p),'kW')
	print('n Specific Fuel Consumption:                               %0.5f'%(sfc),'g/kW.hr')

	print('n+------------------------------------------------------------------------------+')
	print('                              END OF SIMULATION                                   ')
	print('+---------------------------------------------------------------------------------+')


else:
	print('-----------------------------------------File not recognized. Please provide a valid CONVERGE output file------------------------------------------------')
Explanation of the codes:
- First of all ,all the required libraries are imported in which prettytable library is imported to tabulate the engine parameters together.
- Now the file name is entered ,in this case the file name is entered using input command so the we need to enter the name of the file in the output terminal .
- The whole program will run under the if loop because if the filename is incorrectly entered in the terminal there is an else statement which will print out "File not recognized. Please provide a valid CONVERGE output file" statement to the screen.
- f.readline() command is used to read a single line at a time .
- 3rd line of the file belongs to the column name of the data so it is stored in an array called column_name.
- Similarly the units of the parameters is stored in an array called units.
- The column name with their respective units are now tabulated using PrettyTable command under a for loop to the range 1 to length of column name.
- Now we need to store all the data into their respective empty arrays.For that we need to run a for loop under which an if statement is executed "if '#' not in line:" which means if the # is in the line the code will not execute until the symbol#is present.
- All the datas are stored in their respective arrays.
- Now we need to take an inputof the column number for the x axis and y axis to plot the results.
- To plot the we will use plt.plot() command in which we put column_data[x] in the x axis and column_data[y] in the y axis so the whatever be the input we will give the graph will be plotted with respect to the input given.
- plt.xlabel(column_name[x] + units[x],color = 'g',size = '15') and plt.ylabel(column_name[y] + units[y],color = 'g',size = '15') command is used to print the labels respective to the column number entered along with the units.
- Now we need to calculate the engine performances.
- Firstly the Work done by the engine is calculated.Secondly the Power output of the engine is calculated and thirdly the specific fuel consumption is calculated.
- After the calculation we need to print out all the results on the screen.
- In this way the simulation ends.
Results:
In the first step the name of the file is entered.If the file name is correct the further codes will be executed otherwise the program will say File not recognized. Please provide a valid CONVERGE output file.
Case (i): When the file name is not correct.
Case (ii): When the filename is correct.
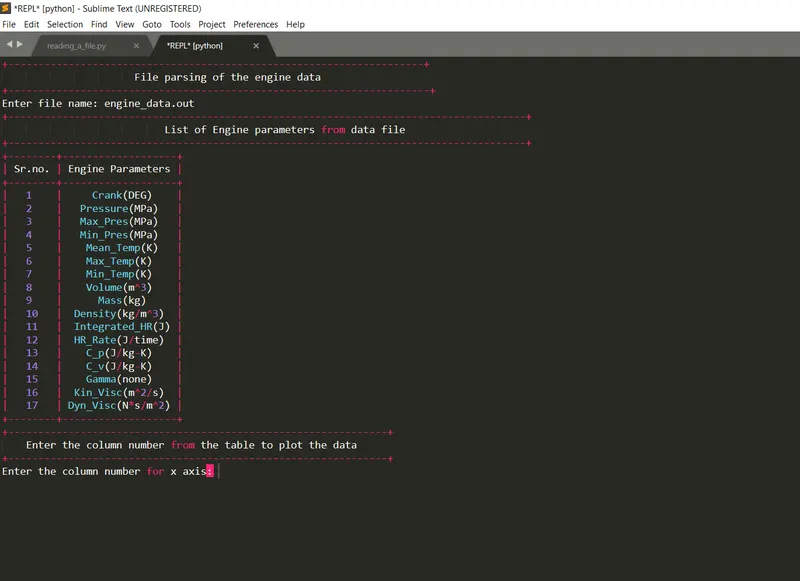
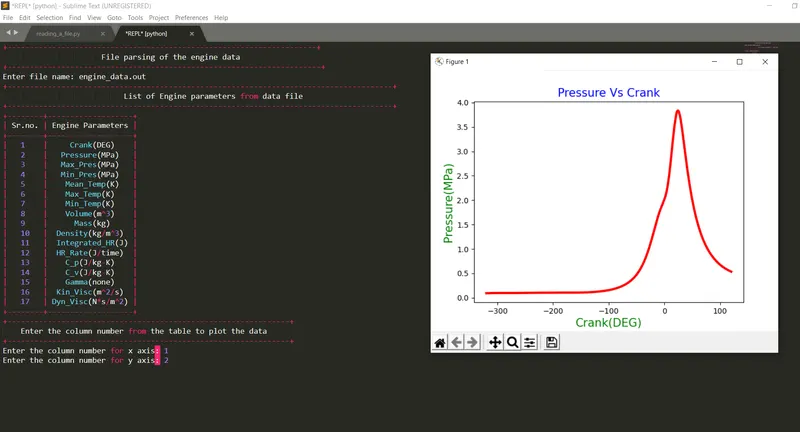
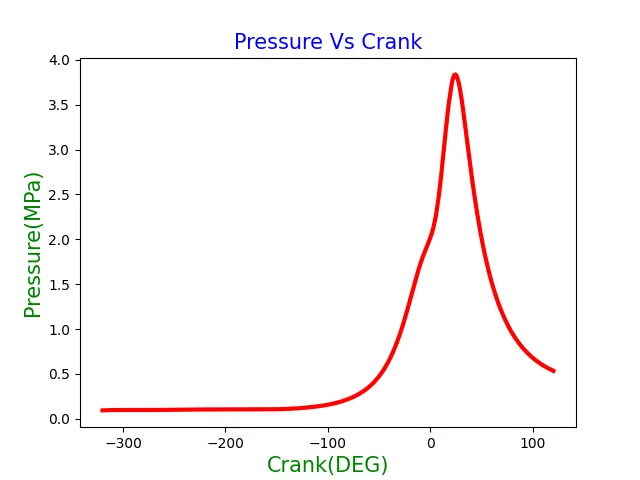
Now we need to enter the column numbers for the x axis and the y axis.Lets assume we need to plot the graph between Pressure and Crank angle ,so we need to enter 1 in the x axis and 2 in the y axis.Now see the results.
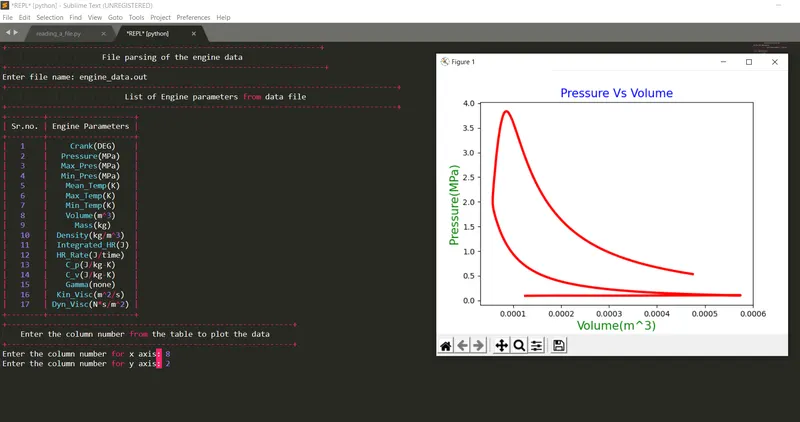
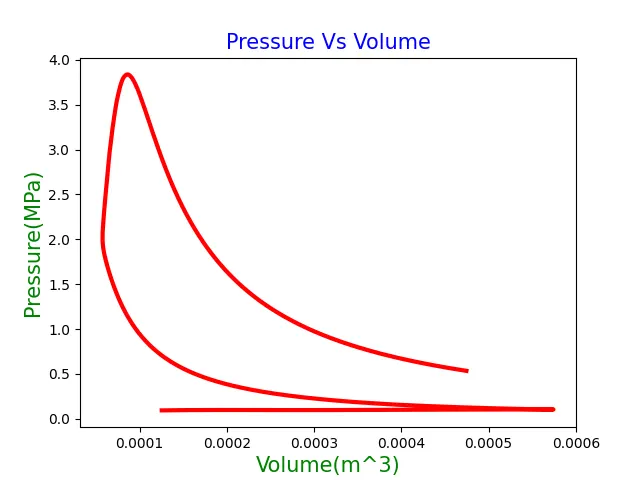
Similarly we can plot the PV diagram for the engine.For that we need to enter the x axis as 8 and 2 as the y axis.Now see the results.
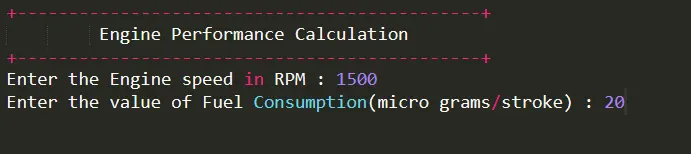
Now We need to calculate the engine performances.For that we need to enter the engine rpm as 1500 and fuel consumption as 20(microgram/stroke):
Now we get the ouput results after hitting enter.