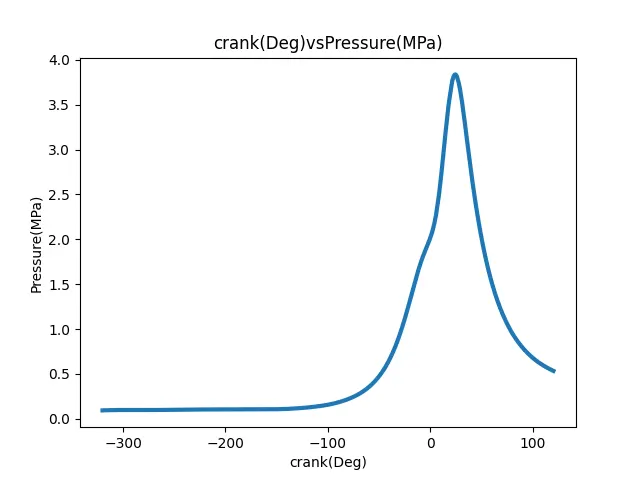
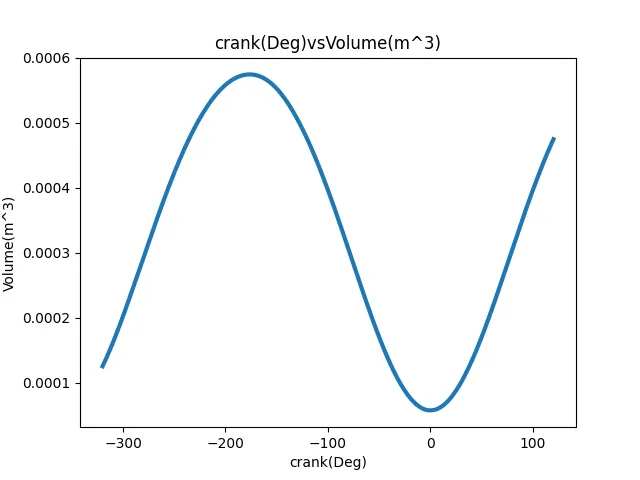
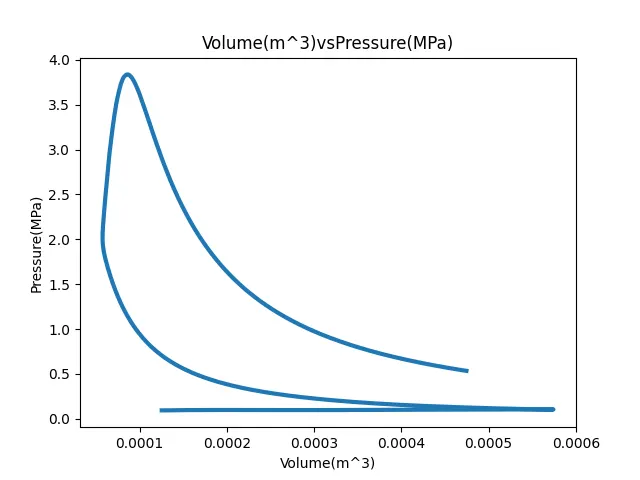
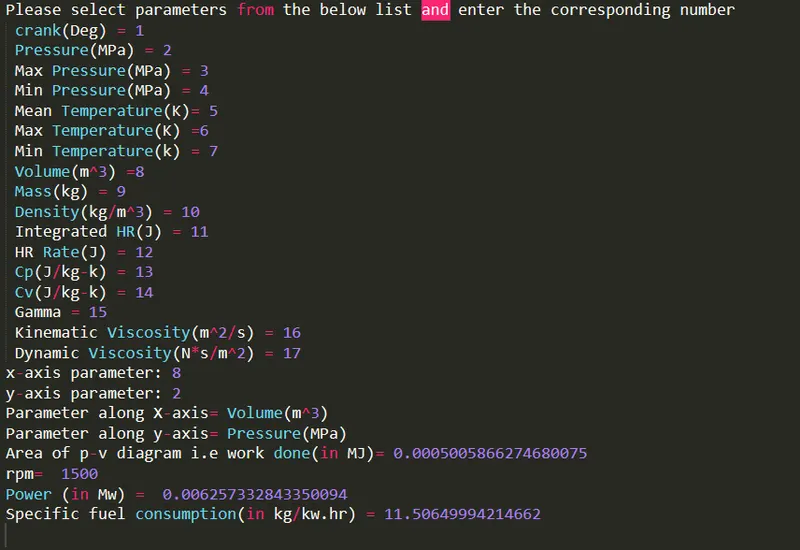
Aim:-Write Python program for Data Visualization, compatibility check, and basic performance calculation for the given data.

Theory:-  In this challenge, we have been given the engine data using these data needs to plot graph on the basis of user input. Some basic calculations are also needs to be done.

Data Visualizer:- It is the way to analyse the data just by looking at numbers we can not analyse the nature of the graph so by plotting on the graph becomes an easier way. Using data from user input plot graph between them also shows the parameters.
Compatibility:- It is the way to check whether data is in the required format or not. If not in the required format then it automatically exits from the file.
Basic Calculation:- Basic calculation is done by using some basic formulas

1  Area under the curve (i.e. work done):-

To calculate the area under the p-v diagram can be calculated by assuming the area as the trapezoidal shape with the help of pressure and volume values taken from the engine data.

2  Power:-
Here assuming 4 stroke engine
                       N=RPM/60                ( for 2 stroke engine)
                       N=RPM/(2*60)            (for 4 stroke engine)
                      Power= Area*N
3 Specific fuel consumption= (mass flow rate*3600)/power

Given Data:-

           RPM= 1500
           Fuel Consumption= 20 micro gram
Procedures:-
1 Import matplotlib , numpy and math for further requirements.

2 Check compatibility of the given engine data, open the data if it is not opening then close the file and exit the process and let the person know about the incompatibility of the file.

3 If the datasheet successfully opened, ask the user to enter the desire corresponding numbers for the x and y-axis respectively from the provided name.

4 Provide empty array for desire x and y-axis data also for pressure and volume to calculate the area under the p-v curve.

5 Now using the NumPy function calculates the area and print by taking the area as trapezoidal shape.

6  Calculate power and specific fuel consumption for given input data.

7. Plot the graph between given 2 inputs for x and y-axis using the function of matplotlib also save the file.

Code:-

# Python program for Data Analysis
#By Rohit

import matplotlib.pyplot as plt

import math

import numpy as np

# To check compatability using try and except loop also file is not compatible then it will exit the file.

try:

 open('engine_data.out')

except:

	print("File not recognized. Please provide a valid CONVERGE output file")
	exit()

#Providing user input code

print("Please select parameters from the below list and enter the corresponding number")

print(' crank(Deg) = 1\n Pressure(MPa) = 2\n Max Pressure(MPa) = 3\n Min Pressure(MPa) = 4 \n Mean Temperature(K)= 5\n Max Temperature(K) =6\n Min Temperature(k) = 7\n Volume(m^3) =8 \n Mass(kg) = 9\n Density(kg/m^3) = 10\n Integrated HR(J) = 11\n HR Rate(J) = 12\n Cp(J/kg-k) = 13\n Cv(J/kg-k) = 14\n Gamma = 15\n Kinematic Viscosity(m^2/s) = 16\n Dynamic Viscosity(N*s/m^2) = 17')

data1= int(input('x-axis parameter: '))

data2= int(input('y-axis parameter: '))

para1=["crank(Deg)","Pressure(MPa)","Max Pressure(MPa)","Min Pressure(MPa)","Mean Temperature(K)","Max Temperature(K)","Min Temperature(k)","Volume(m^3)","Mass(kg)","Density(kg/m^3)","Integrated HR(J)","HR Rate(J)","Cp(J/kg-k)","Cv(J/kg-k)","Gamma","Kinematic Viscosity(m^2/s)","Dynamic Viscosity(N*s/m^2)"]

para2=["crank(Deg)","Pressure(MPa)","Max Pressure(MPa)","Min Pressure(MPa)","Mean Temperature(K)","Max Temperature(K)","Min Temperature(k)","Volume(m^3)","Mass(kg)","Density(kg/m^3)","Integrated HR(J)","HR Rate(J)","Cp(J/kg-k)","Cv(J/kg-k)","Gamma","Kinematic Viscosity(m^2/s)","Dynamic Viscosity(N*s/m^2)"]

a= data1-1

b=data2-1

x_axis1=para1[a]

y_axis1=para2[b]

print('Parameter along X-axis=',x_axis1)

print('Parameter along y-axis=',y_axis1)
# create empty array for desire inputs also for volume and pressure
x_axis=[]

y_axis=[]

pressure=[]

volume=[]

line_count=1

for line in open('engine_data.out'):

	if '#' not in line:

		x_axis.append(float(line.split()[a]))

		y_axis.append(float(line.split()[b]))

		pressure.append(float(line.split()[1]))

		volume.append(float(line.split()[7]))

		line_count=line_count+1

# Area under P-V Curve

Area = np.trapz(pressure,volume)

print('Area of p-v diagram i.e work done(in MJ)=',Area)
# Power output
#Assuming 4 stroke engine so,

rpm = 1500

print('rpm= ', rpm)

n = 1500/(2*60)

Power= Area*n

print('Power (in Mw) = ',Power )

# specific fuel consumption

#fuel consumption per stroke(in gm)

m = 20*10**(-6)

# Specific fuel comsumption in kg/kw.hr

Spfc = (3600*m)/Power

print('Specific fuel consumption(in kg/kw.hr) =',Spfc)

# plotting graph between desire inputs

plt.figure(x_axis1 + 'vs' + y_axis1)

plt.plot(x_axis,y_axis,linewidth=3)

plt.xlabel(x_axis1)

plt.ylabel(y_axis1)

plt.title(x_axis1 +'vs' + y_axis1)

plt.show()

Results:-
The graph has been successfully plotted using input from the user and the area under the P-V curve is 0.00050058 MJ, Power is 0.00625 MW and specific fuel consumption is 11.506 kg/Kw.hr.