Data Analysis & Visualisation using Python
Aim:
To write a python program that can be used for Data Visualisation with a compatibility check and do basic performance calculation.
Objectives:
- Make a data visualiser using column numbers as inputs.
- Have a compatibility check to exit gracefully.
- Calculate performance by finding area under P-V diagram and output of engine
Body of the Contents:
Python was the language used to code the following programs.
Programs:
# DATA ANALYSIS

import math
from scipy.integrate import simps
import matplotlib.pyplot as plt
import sys

# function to check compatibility of file
def file():
    input_file = input('Enter the file name: ')
    x = input_file.split('.')
    if(x[1] != 'out'):
        print("File not recognized. Please provide a valid CONVERGE output file")
        return file()
    return(input_file)

try:
    input_filename = file()
    fileopened = open(input_filename)
except:
    print('The Input file is not found')
    sys.exit(1)

#asking for required data
i = input('Enter 1st column: ')
j = input('Enter 2nd column: ')

#intialising them as empty arrays for future use
param_1 = []
param_2= []
col_1 = 'Nil'      #intialising
col_2 = 'Nil'      #intialising
ct = 1             #counter

for line in open(input_filename):

    if(ct == 3):
        col_1 = line.split()[int(i)]
        col_2 = line.split()[int(j)]
    if '#' not in line:
        param_1.append(float(line.split()[int(i)]))
        param_2.append(float(line.split()[int(j)]))

    ct = ct+1   #counting every iteration

#intialising empty array
pressure = []
volume = []

for line in open(input_filename):

    if '#' not in line:
        pressure.append(float(line.split()[1]))
        volume.append(float(line.split()[7]))

area = float(simps(pressure, volume))       #Area calculation

print('Area is ' + str(area))               #printing the calculated area

#Given Parameters
rpm = 1500
speed = rpm/60

power = speed*area          #power calculation
print('The engine Power Output is ' + str(power))

FuelMass = 20*pow(10,-6)
specfuel = FuelMass/power   #specific fuel calculation
print('The specific fuel consumption is ' + str(specfuel))

#Plotting the user requested graph
plt.plot(param_1, param_2)
plt.xlabel(col_1)
plt.ylabel(col_2)
file_name = str(col_2) + ' vs ' + str(col_1)
plt.title(file_name)
plt.savefig(file_name + '.png')
plt.show()
plt.clf()

#Plotting the Performance graph between pressure and volume
plt.plot(volume, pressure)
plt.xlabel('volume')
plt.ylabel('pressure')
plt.fill_between(volume, pressure, color = 'gray')
plt.title('pressure vs volume Graph')
plt.show()
All the required modules like sys, math, matplotlib.pyplot, simps (from scipy.integrate) were imported at the start. A function is made to check the compatibility of the file entered by user. The file is read and the inputs for column numbers are taken to plot the user required graphs.
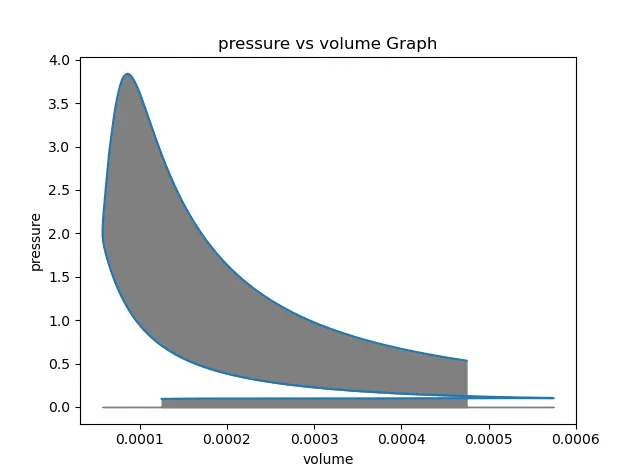
The data points from the columns are taken with help of for loop and finally stored into respective arrays which were initialised to empty arrays before the loop. The pressure and Volume values are similarly appended into respective arrays which were initialised before that for loop as empty arrays. These values are then used to find the area under the PV Diagram. Using the given parameters, the power out, specific fuel are calculated and printed.
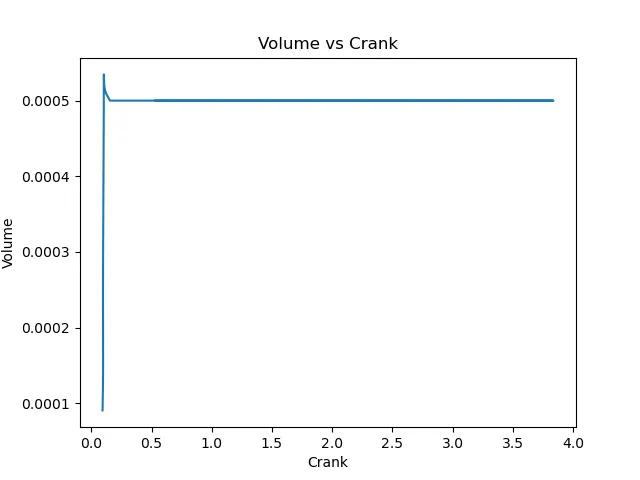
The Graph for the user requested columns is plotted and consequently saved with appropriate name. clf() is used to clear the plots so that PV plot can be made. The PV diagram is plotted and shown.
Results:
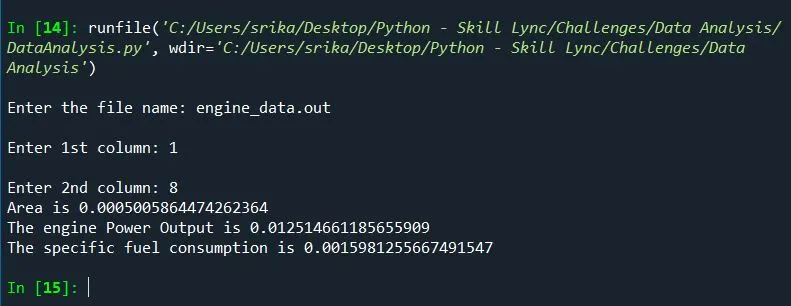
- Area is 0.0005005864474262364
- The engine Power Output is 0.012514661185655909
- The specific fuel consumption is 0.0015981255667491547
- The PV plot:
- Plot for columns requested by user (in this case 1 & 8):
- The required output as an image:
Conclusions:
- Program ran successfully
- Data Analysis is a an important skill required to parse through large data sets.