Week 6 - Data analysis
Aim:
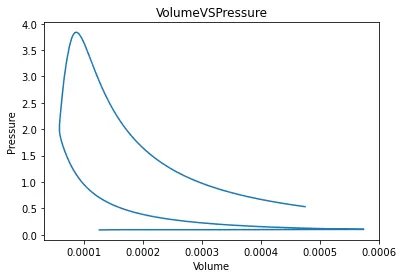
To create a code that performs following tasksCalculate the area under the P-V diagram.
P is in column 2 and V is in column 8.Calculate the power output of this engine. Assume that RPM is 1500
This engine consumed 20 micro grams of fuel (per 1 stroke cycle). Calculate its specific fuel consumption.
Procedure
first we should downlaod the engine data file and make sure that the date file must me saved in the location where your program file is saved
Here we use two plot graphs between two parameters (crank angle, temperature , pressure, volume etc)
here we ask user to give inputs of 0 and 1
the code for this problem is
import numpy as np
import matplotlib.pyplot as plt
import math
from scipy.integrate import simps
try:
    data=open("engine_data.out")
except FileNotfoundError:
    print("the file is not recognised,please provide a valid file")
#stating the reference for giving input
parameters=['Crank-angle','Pressure','Max Pressure','MinPressure','MeanTemparature','MaximumTemparature','MinimumTemparatue','Volume','Mass','Density','IntegratedHeatRejection','HeatRejection Rate','Cp','Cv','Gamma','KinematicViscosity','DynamicViscosity']
print('parameters present in the given data:')
print(parameters)
corresponding_num=['Crankangle=0','Pressure=1','Maximum Pressure=2','MinimumPressure=3','MeanTemparature=4','MaximumTemparature=6','MinimumTemparatue=5','Volume=7','Mass=8','Density=9','IntegratedHeatRejection=10','HeatRejection Rate=11','Cp=12','Cv=13','Gamma=14','KinematicViscosity=15','DynamicViscosity=16']
print('corresponding values to be given as input')
print(corresponding_num)
#asking relevant input from the user
first_column=input("please enter the first parameter value:")
second_column=input("please enter the second parameter value:")
column_1=int(first_column)
column_2=int(second_column)
column1_val=[]
column2_val=[]
count=1
#extracting the asked data from the file
for line in open('engine_data.out'):
#saving the name of the columns asked
    if count == 3:
        column_name1=line.split()[column_1+1]
        column_name2=line.split()[column_2+1]
#extracting the column values from thefile
    if '#' not in line:
            column1_val.append((float(line.split()[column_1])))
            column2_val.append((float(line.split()[column_2])))
    count=count+1
#plotting the requested parameters
plt.plot(column1_val,column2_val,'r')
plt.xlabel(column_name1)
plt.ylabel(column_name2)
plt.title(column_name1+'VS'+column_name2)

#calculation of area under p-v curve
column_3=1
column_4=7
count=1
column3_val=[]
column4_val=[]
for line in open('engine_data.out'):
    if count == 3:
        column_name3=line.split()[column_3+1]
        column_name4=line.split()[column_4+1]
#extracting the column values from the file
    if '#' not in line:
            column3_val.append((float(line.split()[column_3])))
            column4_val.append((float(line.split()[column_4])))
    count=count+1
#area
area=float(simps(column3_val,column4_val))
plt.figure(2)
plt.savefig('P-V diagram')
plt.plot(column4_val,column3_val)
plt.title(column_name4+'VS'+column_name3)
plt.xlabel(column_name4)
plt.ylabel(column_name3)
print('Area under P-V curve is:')
print(area)
#calculation of output power and specific fuel consumption
#inputs
#speed
N=1500/60
#fuel consumed in micro grams
f_c=20*pow(10,-6)
#output power in kilo watts
Op=float(area*N)
print('output power of engine is:')
print(Op)
#specific fuel consumption in kilograms/kw.hr
sfc=(f_c/Op)
print('specific fuel consumption is:')
print(sfc)
after running the code we get following results
1) area under P-V curve is
0.0005005864474262364
2) output power of engine is
0.012514661185655909
3) specific fuel consumption
0.0015981255667491547
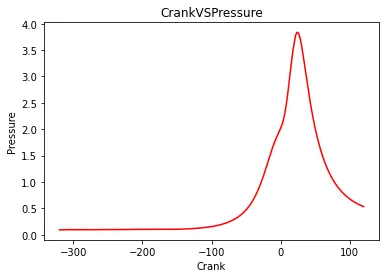
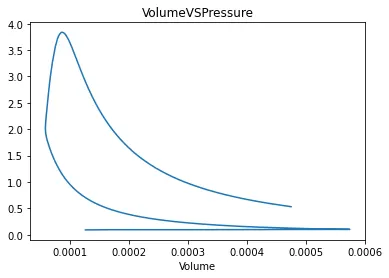
The plots that we can observe after we run the code are
Conclusion
1) area under P-V curve is
0.0005005864474262364
2) output power of engine is
0.012514661185655909
3) specific fuel consumption
0.0015981255667491547