Week 6: Conjugate Heat Transfer Simulation
Objective
Baseline configuration
- Setup a flow simulation through a pipe
- Inlet Reynolds number should be 7,000
- Re = (rho*V*D)/(Dynamic viscosity)
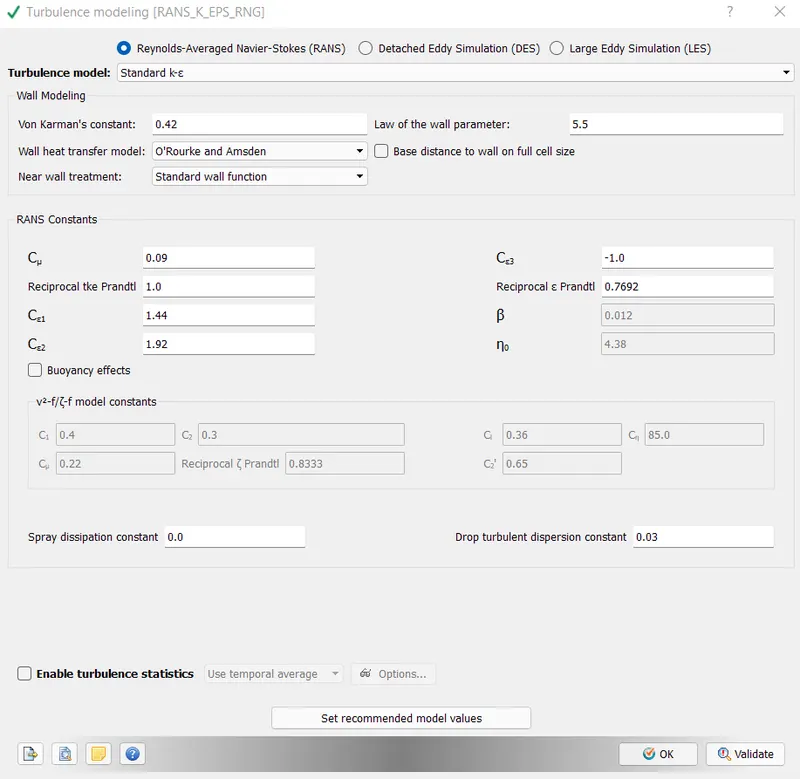
- Turbulence modelling - K-Epsilon
- Supercycling parameters - same as in the video
Additional 3D outputs
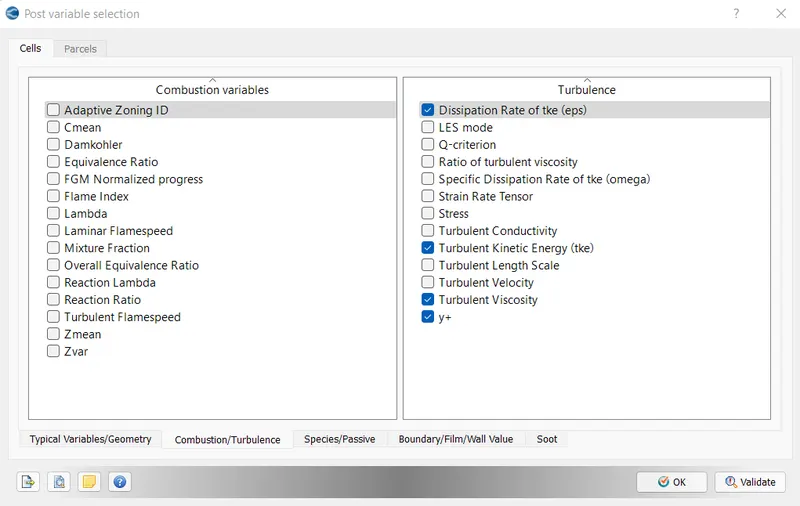
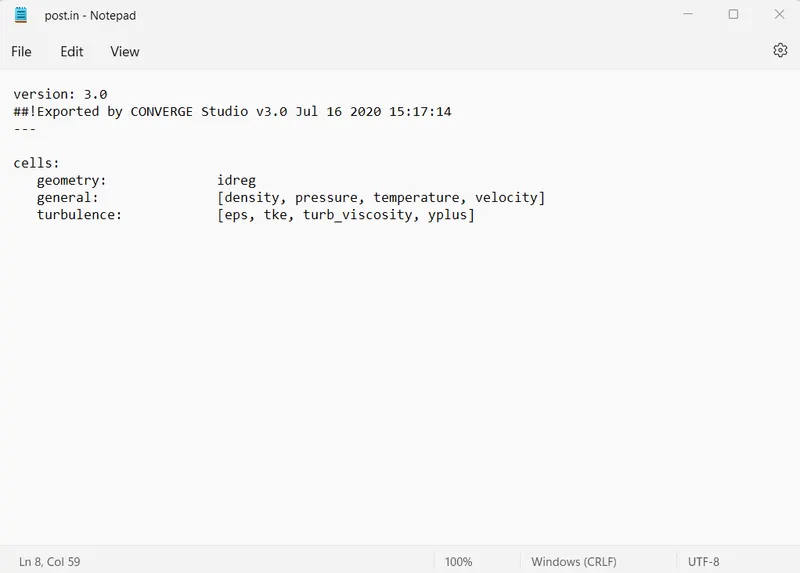
- Add Y+ to your post.in file
Grid dependence test
- Start with an initial base grid
- Run grid dependence test on 3 grids and show that the outlet temperature converges to a particular value
Effect of supercycle stage interval
- Set supercyle stage interval to 0.01,0.02 and 0.03
- For these three values, how does the total simulation time compare against the baseline configuration
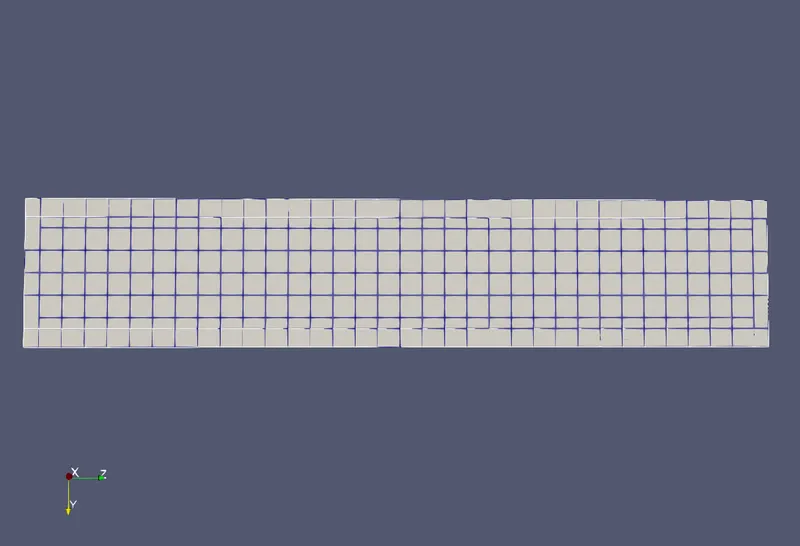
It is expected to show the mesh generation using PARAVIEW.
Also create an animation and upload it on You tube and provide the You tube link for an animaion in your report.
Answer
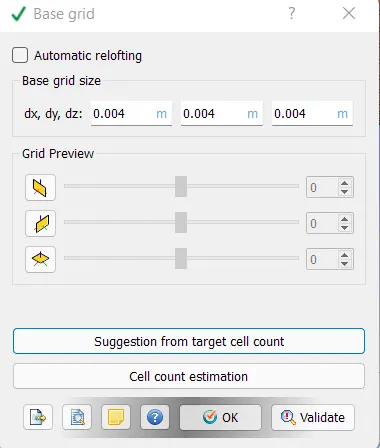
The simulation will be carried out for 0.004m, 0.005m & 0.006m mesh element sizes & and also for supercycle stage intervals which are 0.01, 0.02 & 0.03 by keeping the mesh size constant.
The concept of supercycle stage interval is that the fluid solver will take a pause while the solver for the solid region converges. The pause between the two cycles can be set by the user. The concept of supercycle stage interval is specifically used in the CHT cases. The aim in this study is to determine the effect of the stage interval on the simulation time.
Creating geometry
First Cylinder
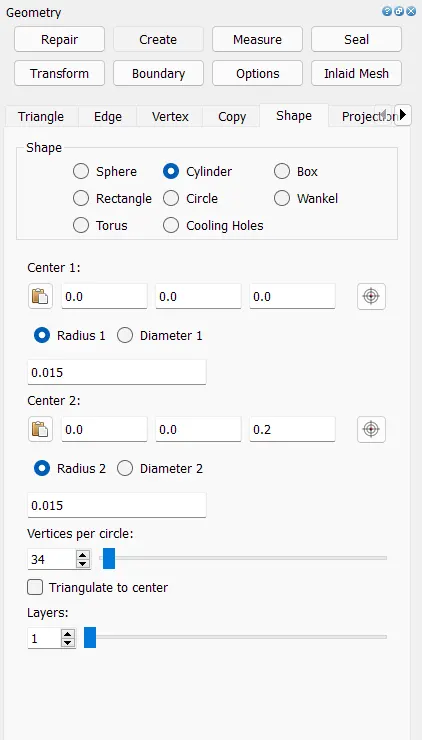
Second cylinder
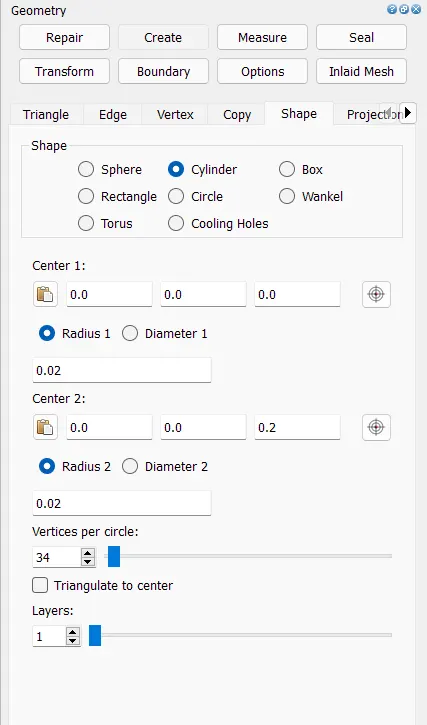
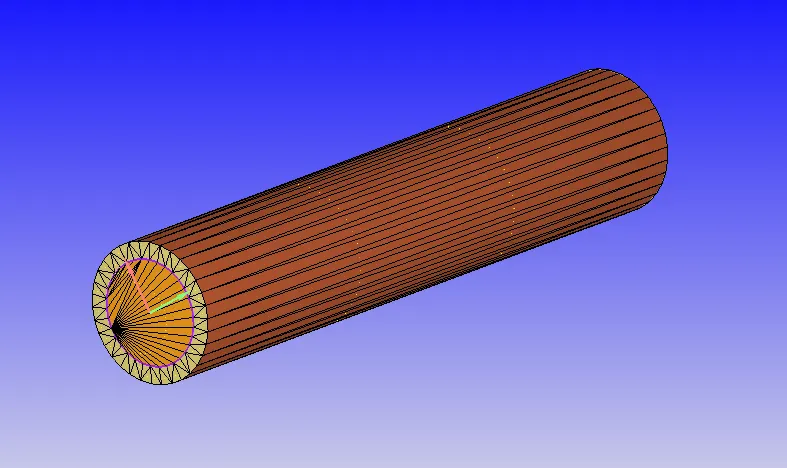
Generated Geometry
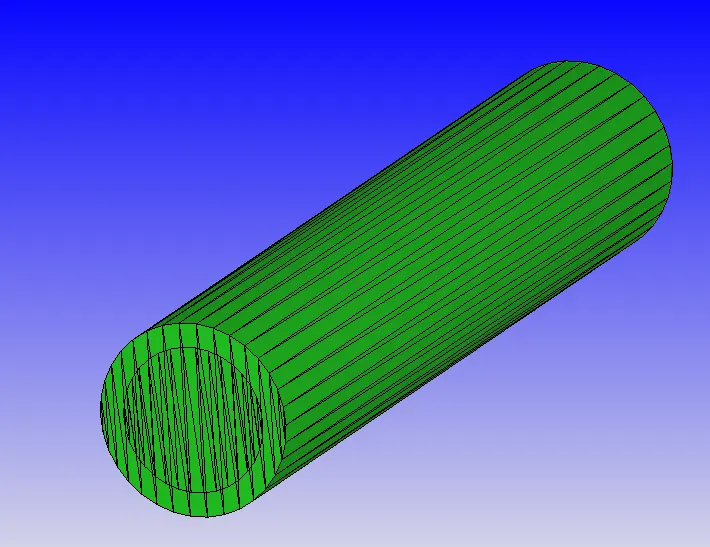
After deleting front & back planar faces & creating triangle surfaces in between two cylinders
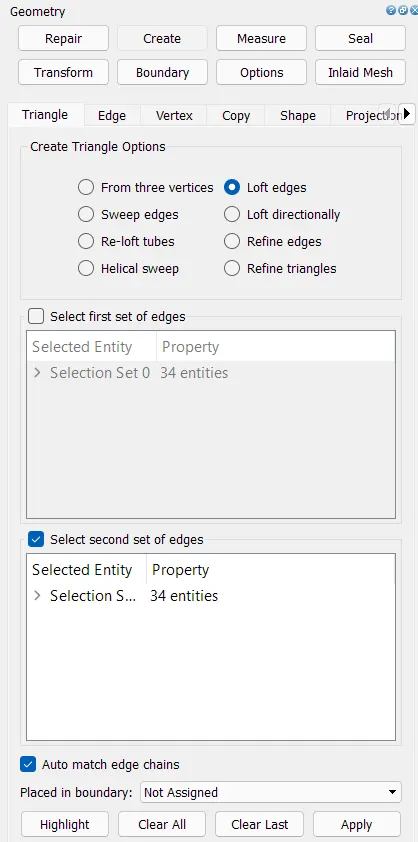
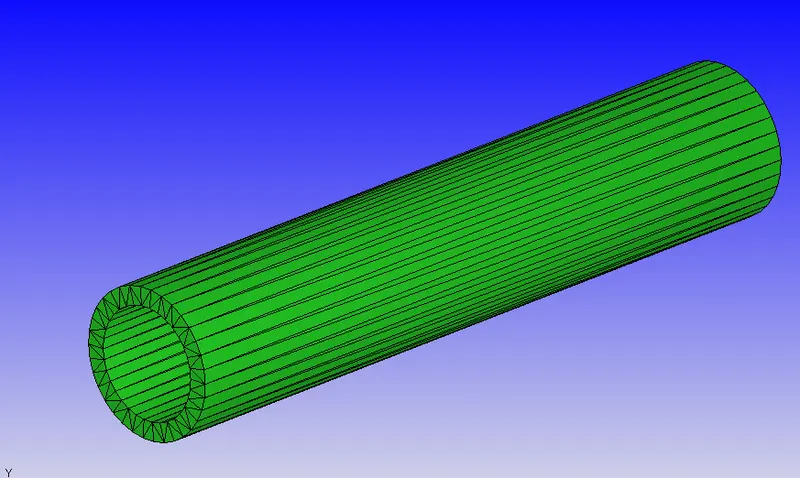
Inlet & outlet Patches
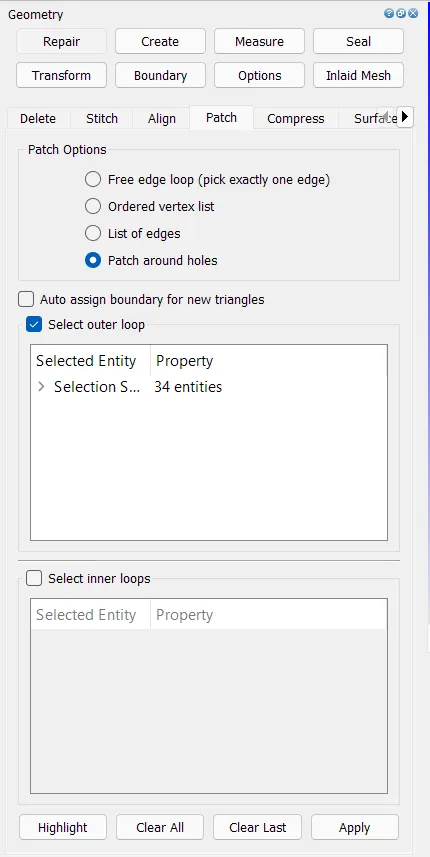
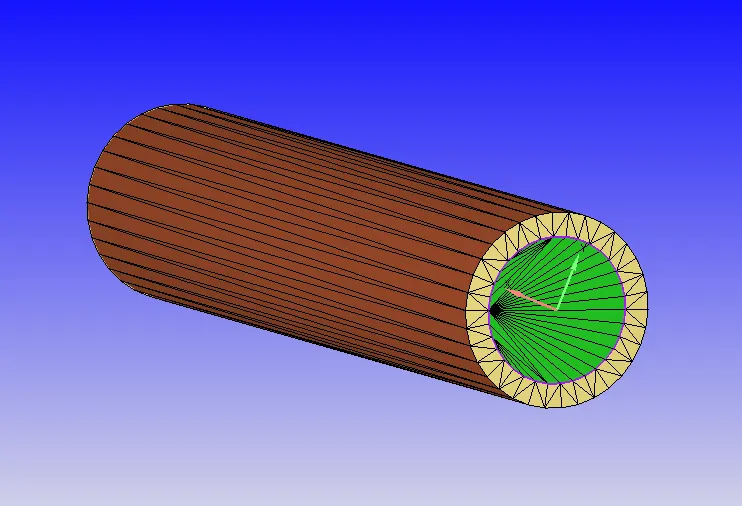
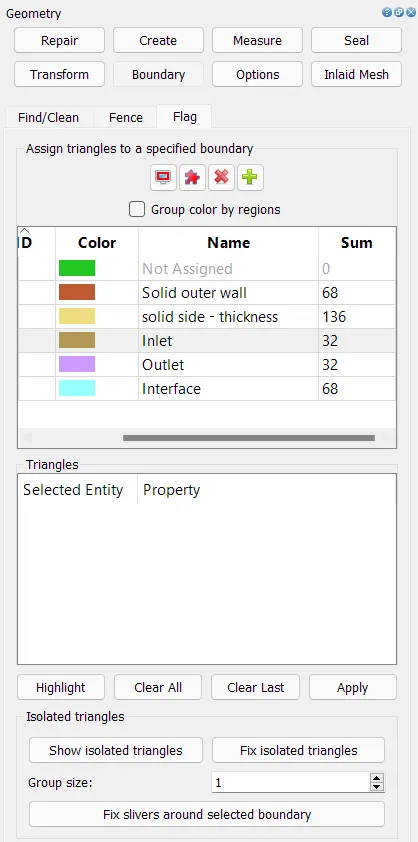
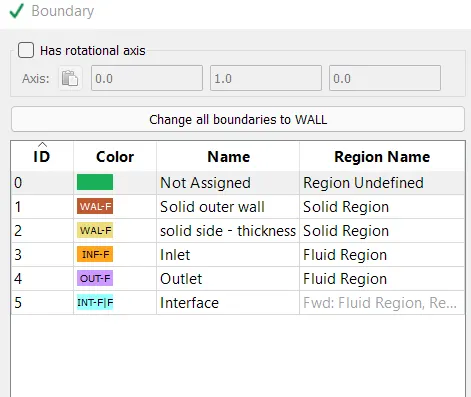
Boundaries
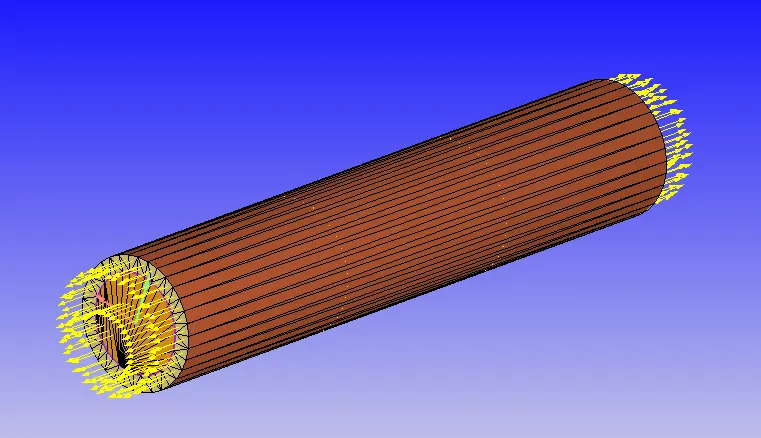
Fixing Normals
They should point inwards.
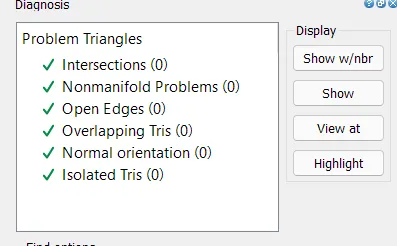
Diagnostics
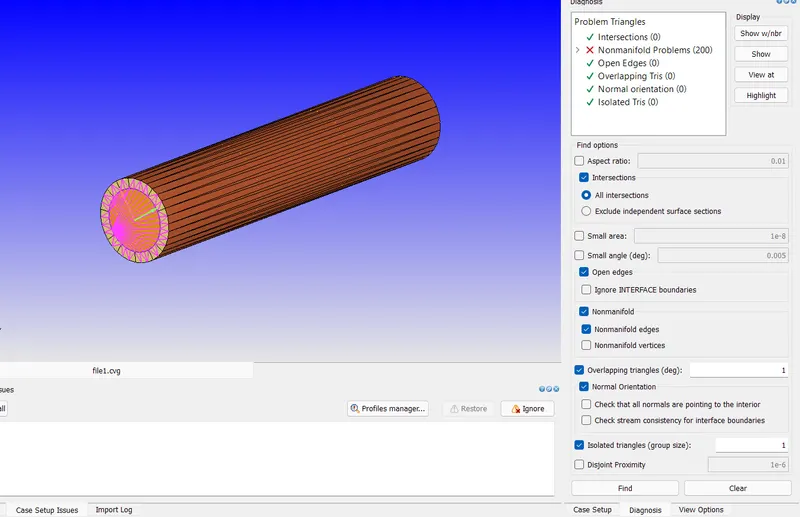
Manifold errors are very common in CHT simulation becuase of presence of interface between fluid & solid regions.
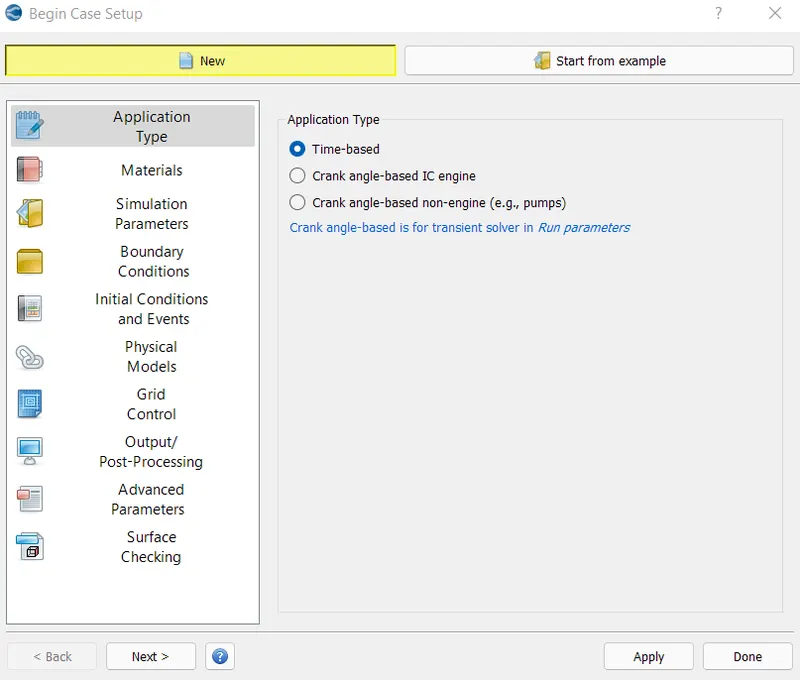
Case Setup
Material
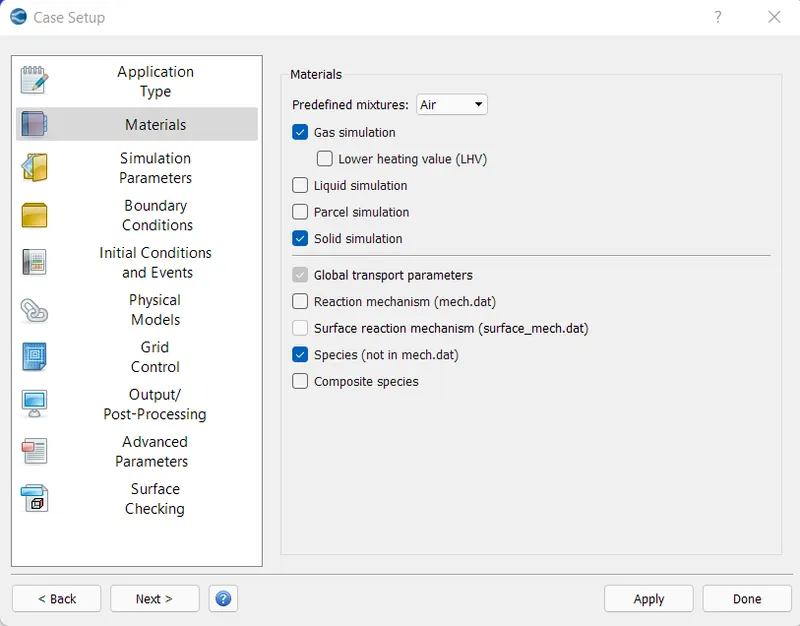
Gas simulation
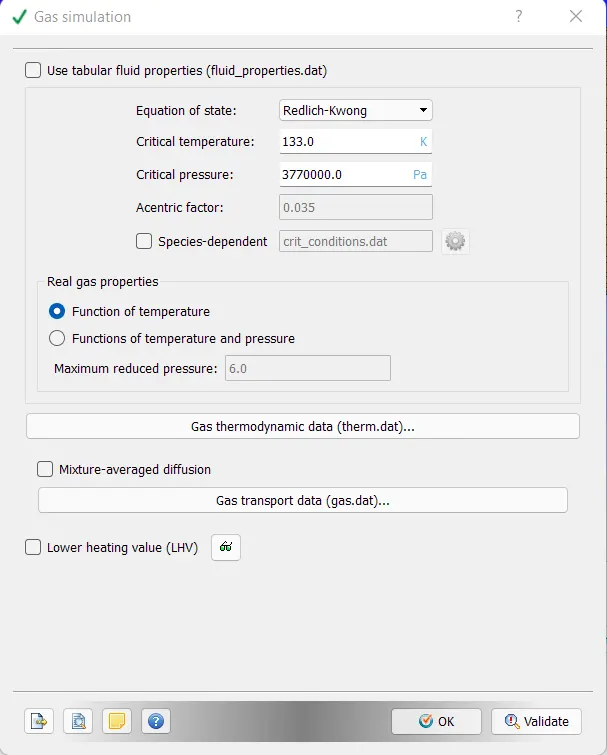
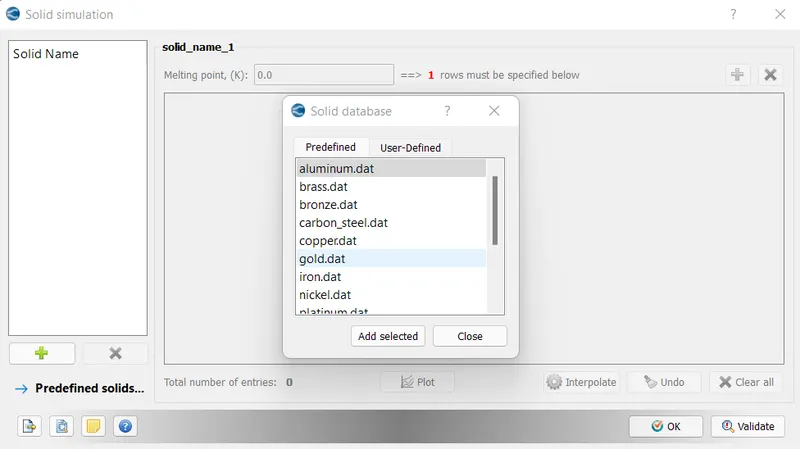
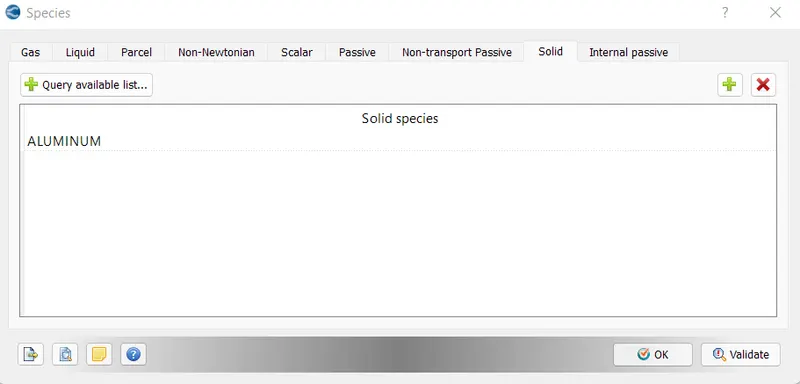
Solid Simulation
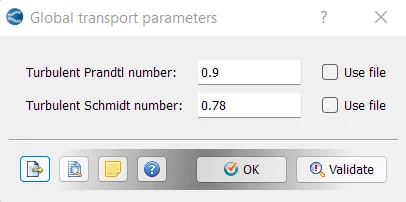
Global Transport Parameters
Species
Adding gas species
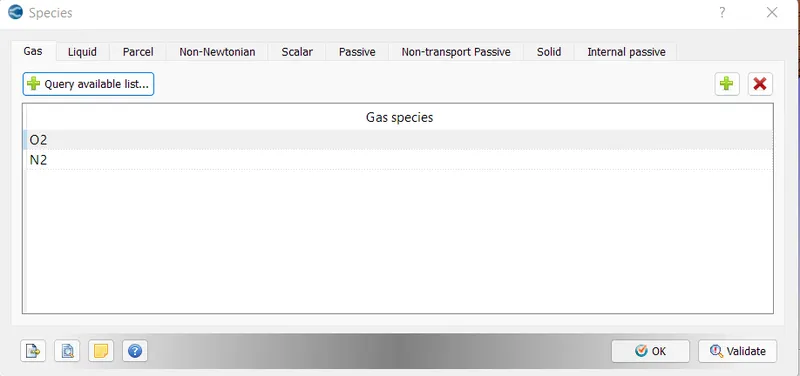
Adding from Query available list
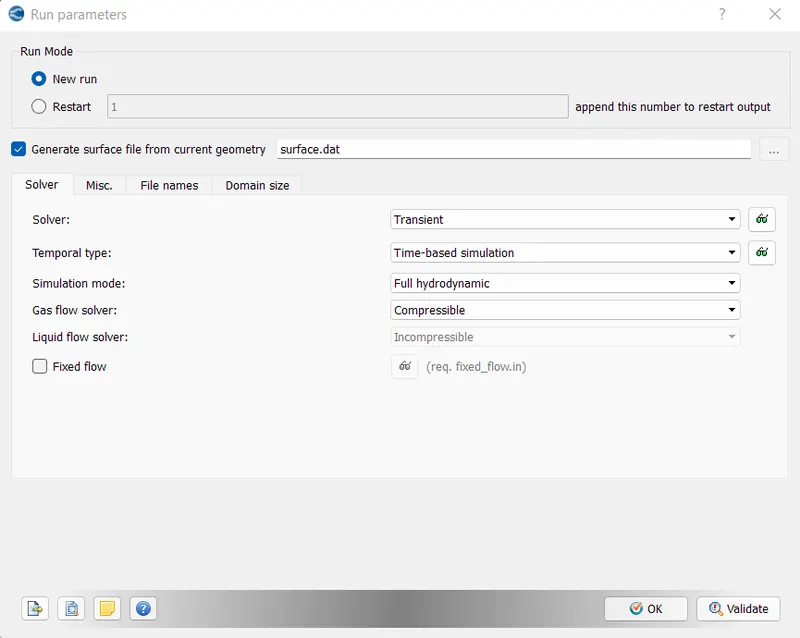
Simulation
Run parameters
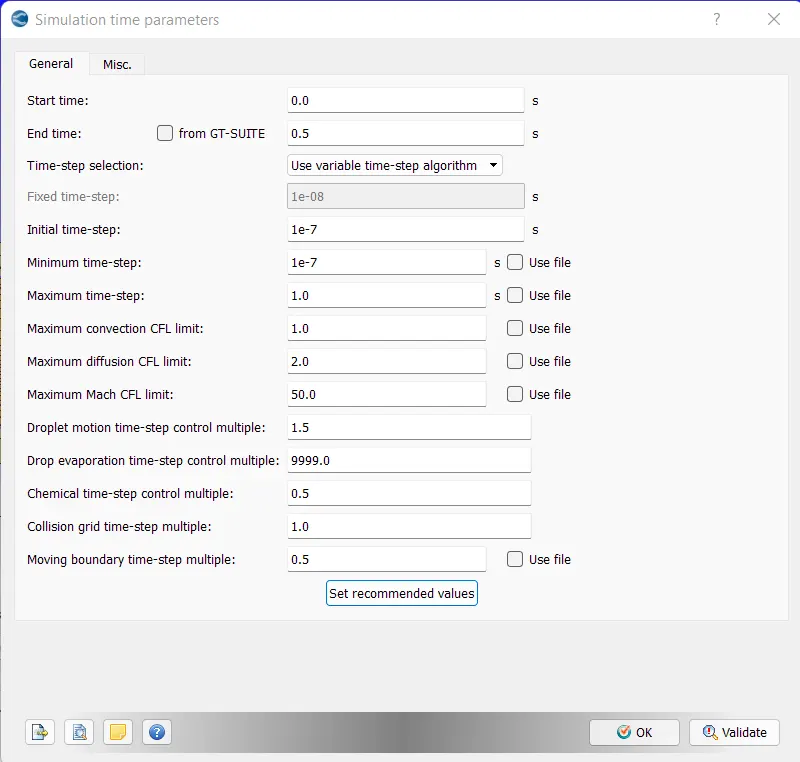
Simulation time parameters
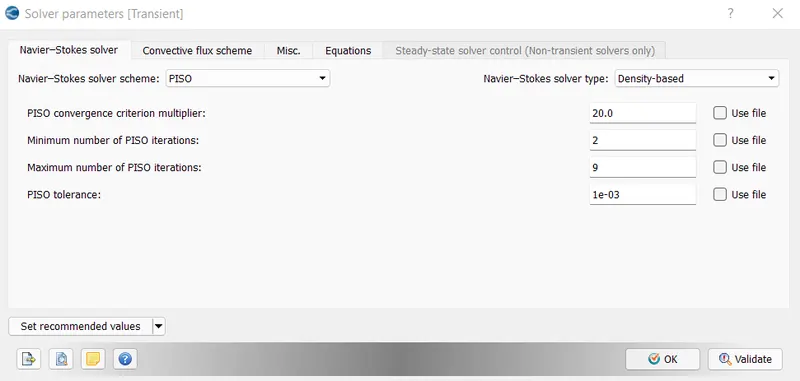
Solver Parameters
Default
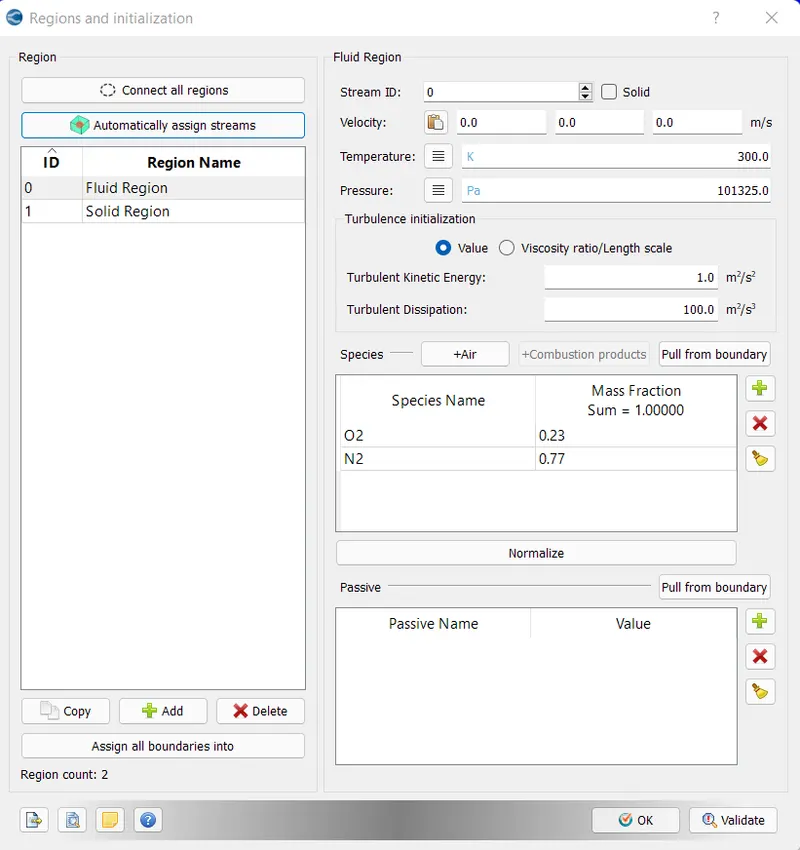
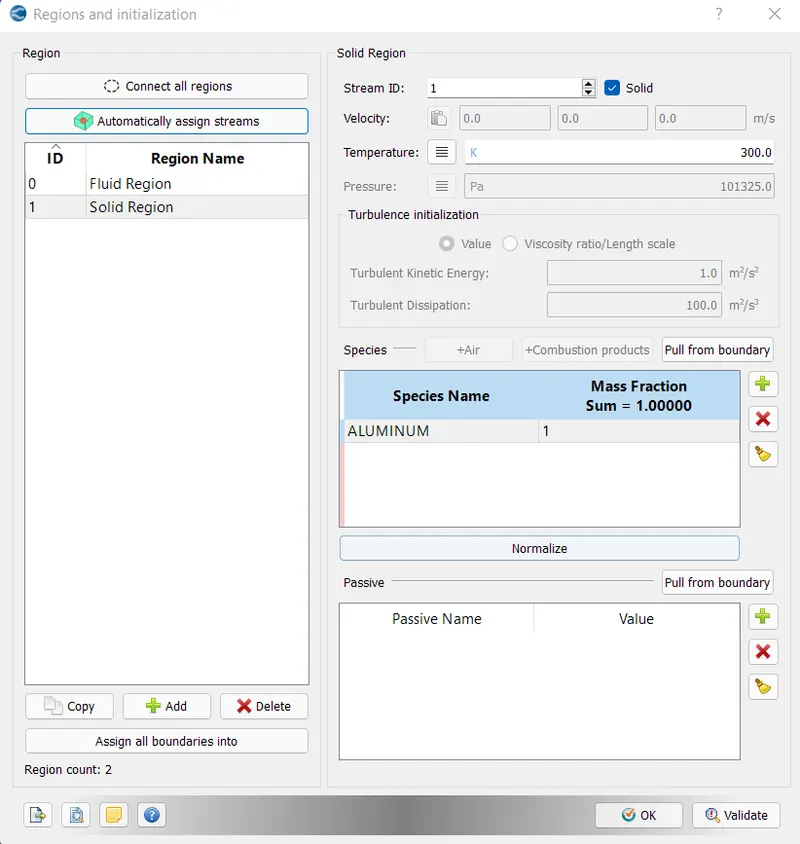
Regions & Initialization
Boundaries
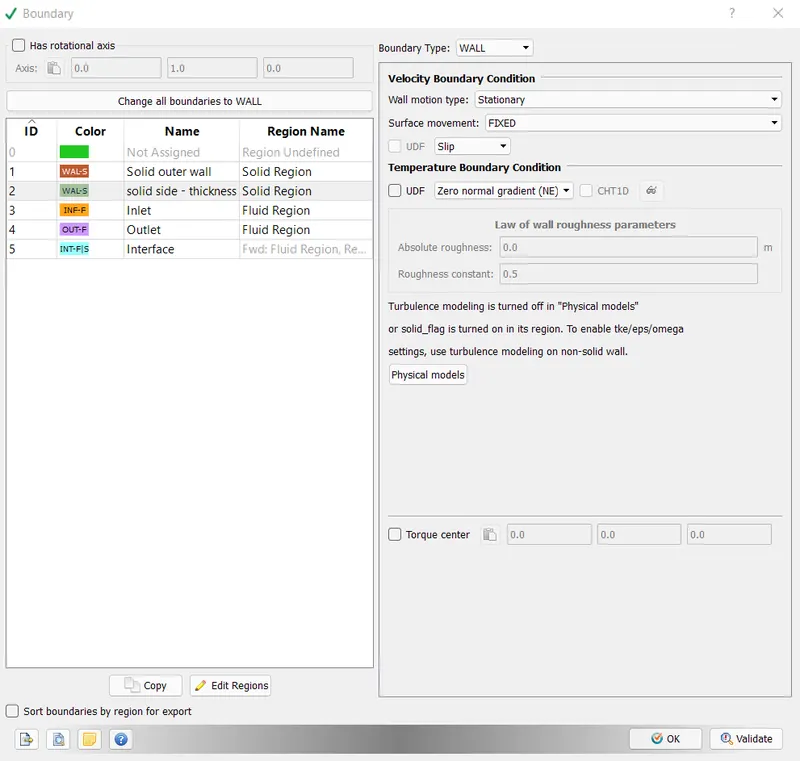
heat flux value is -10000 W/m^2 because heat is flowing inside the region.
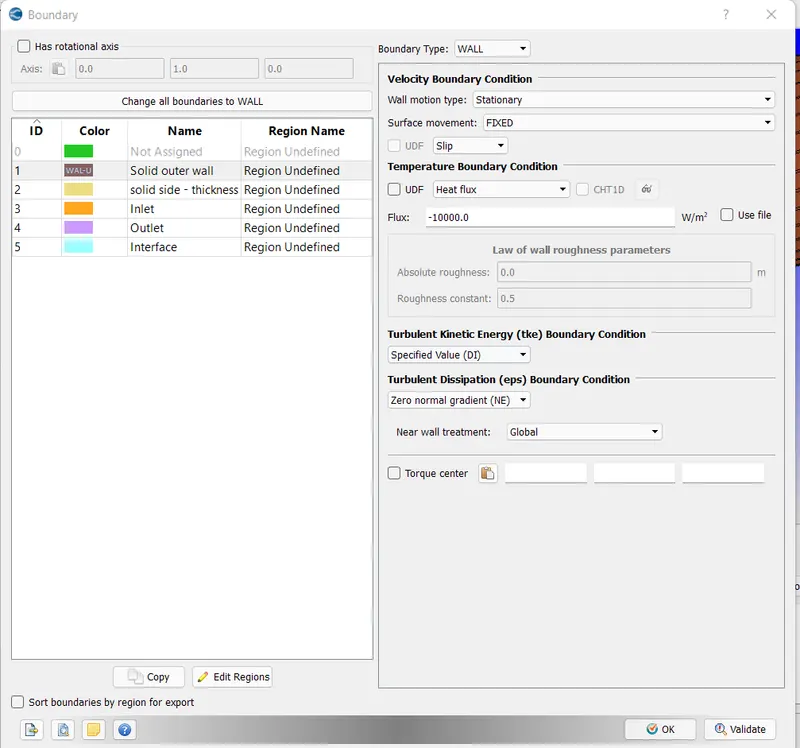
Solid side - thickness
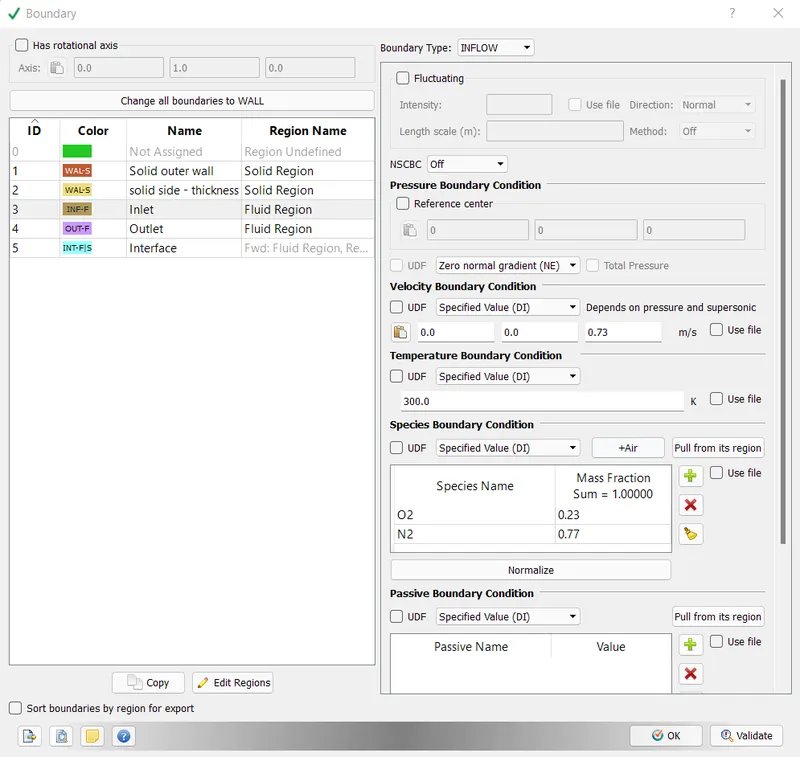
Inlet
to calculate inlet flow speed from the reynolds number, following data has been used.
`Re = (rho*V*D)/mu`
So, `V = (Re*mu)/(rho*D)`
V = (7000 * 0.0000186)/(1.184 * 0.15) = 0.73 m/s
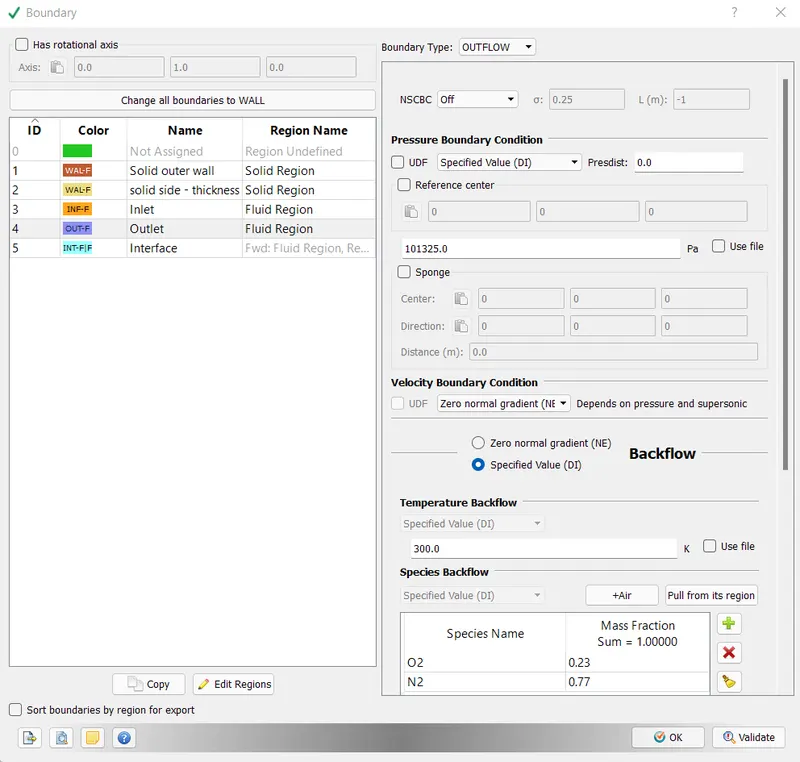
Outlet
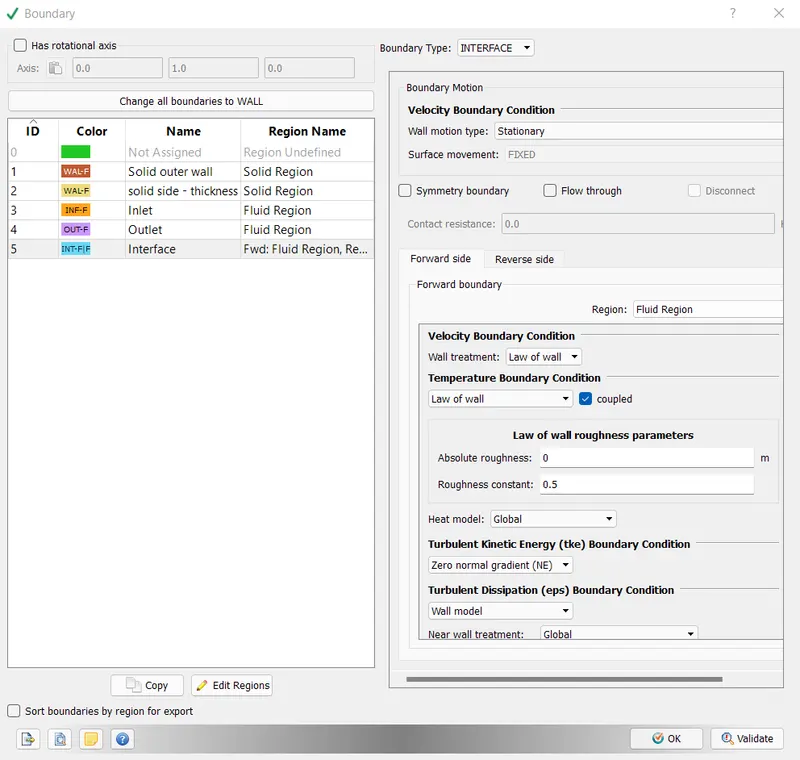
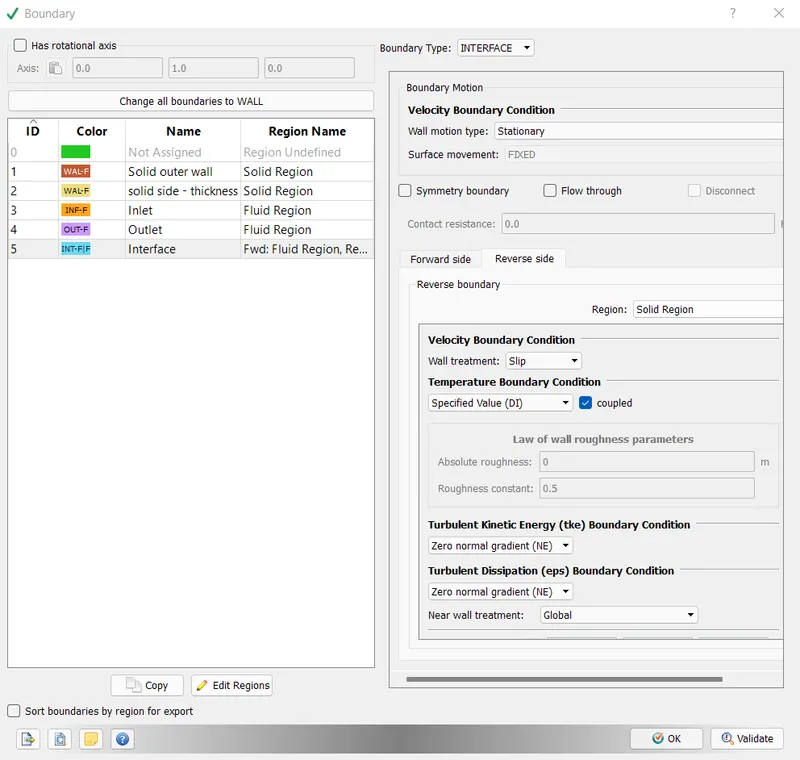
Interface
In interface boundary type, there are two sides, forward & reverse. if Normal is pointing towards fluid, than the fluid region will become the forward side while the other, means solid, becomes reverse side.
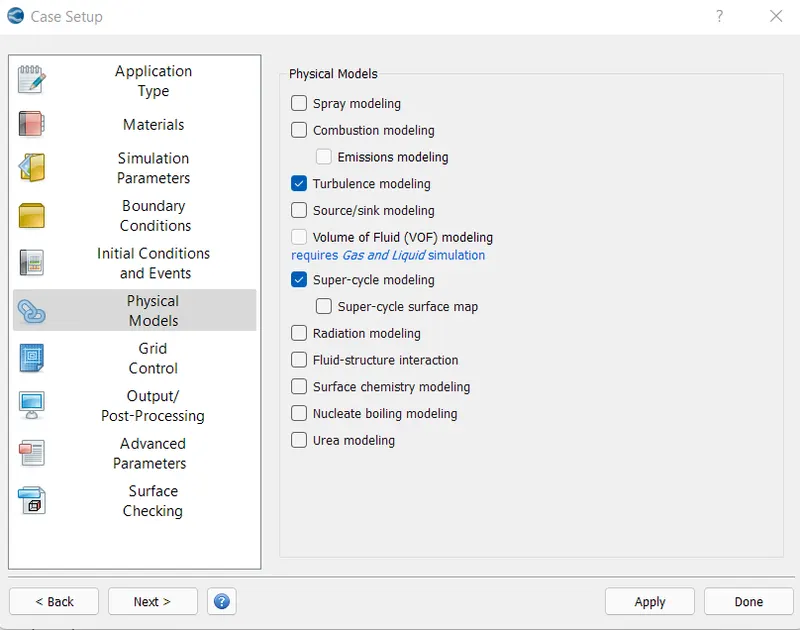
Physical Models
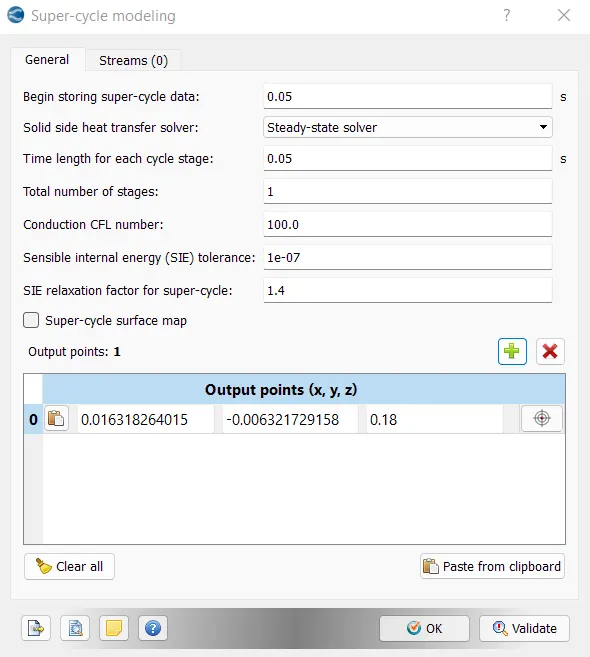
To speed up the CHT process, super-cycle modeling has been used.
Turbulence model
Super cycling modeling
stage interval = 0.01
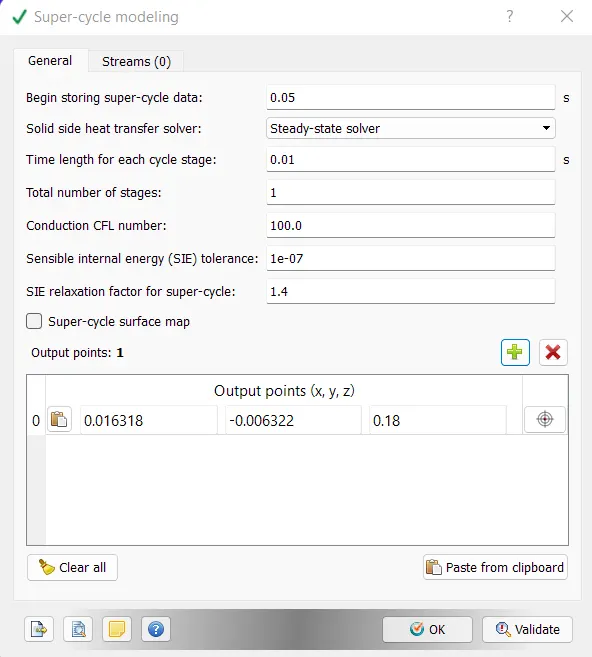
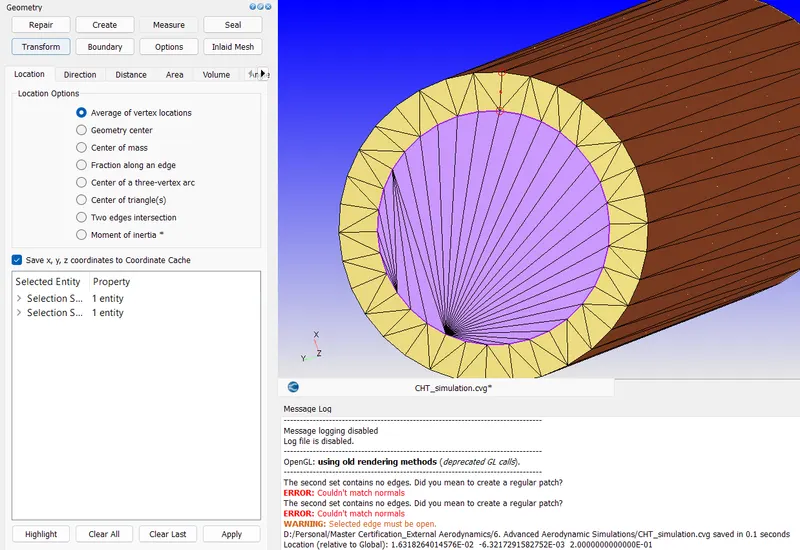
To determine the outpoint location to measure the temperature, measure tool has been used & the location has been determine by taking average of two points.
The location coordinate is inserted into the output points box. To keep the measuring point, little bit inside, the z-dimension has been kept at 0.18.
Base grid
Post variable selection
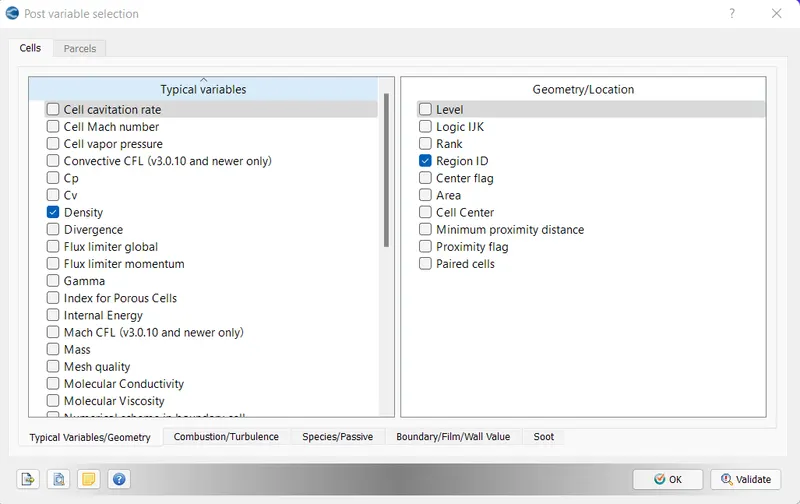
Adding y+ from Turbulenece tab in Post Variabel Selection
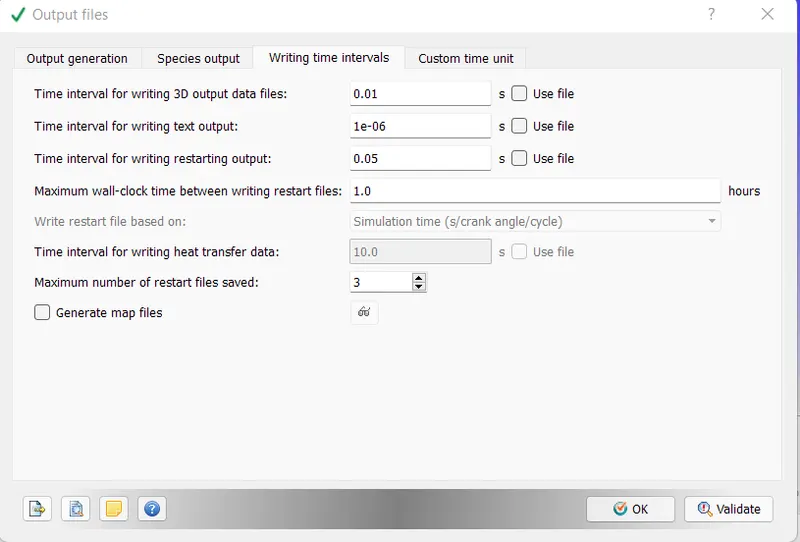
Output files
Final diagnostic
y+ in post.in file
It was opened in Cygwin using following command.
notepad.exe post.in
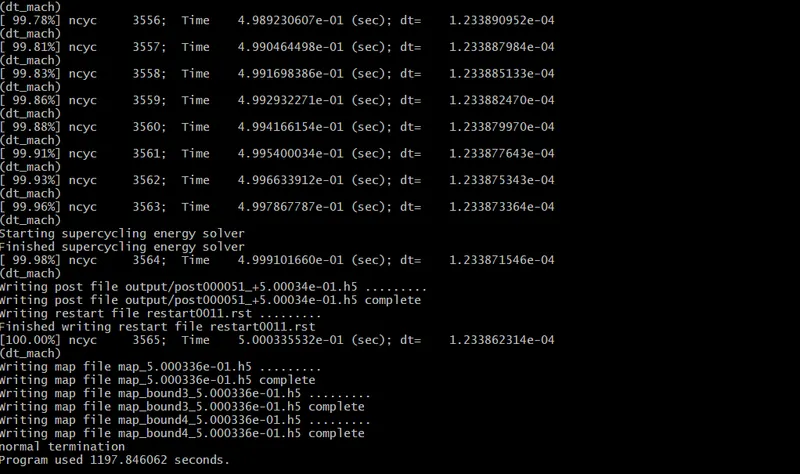
Simulation
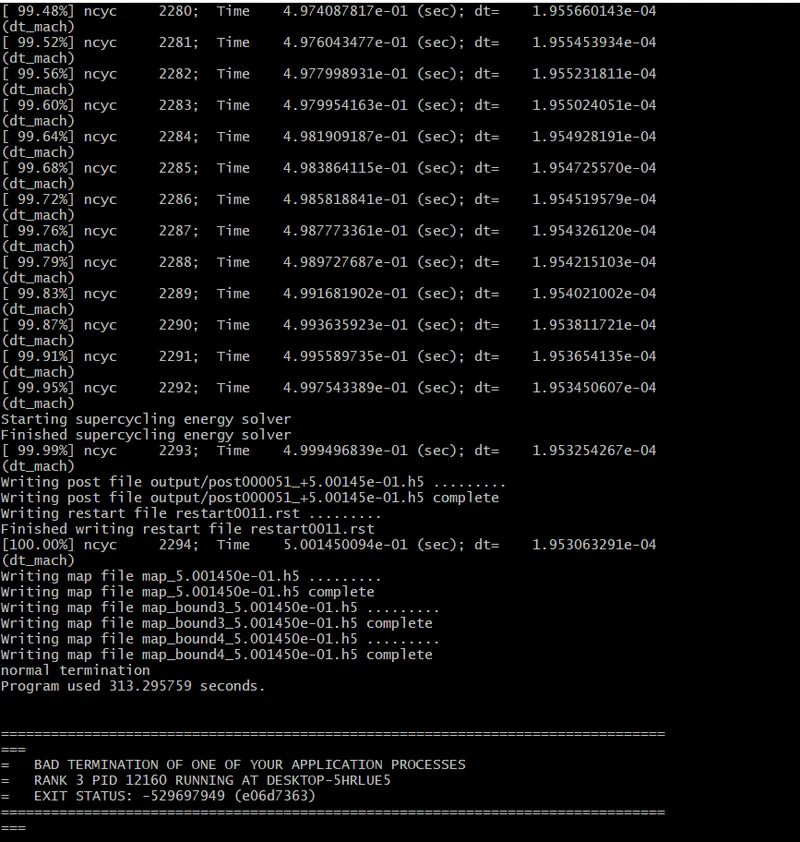
Simulation was perormed in Cygwin using following command:
mpiexec.exe -n converge.exe restricted
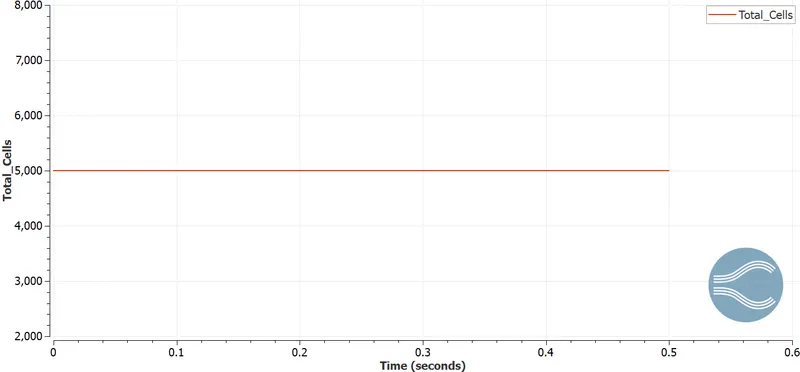
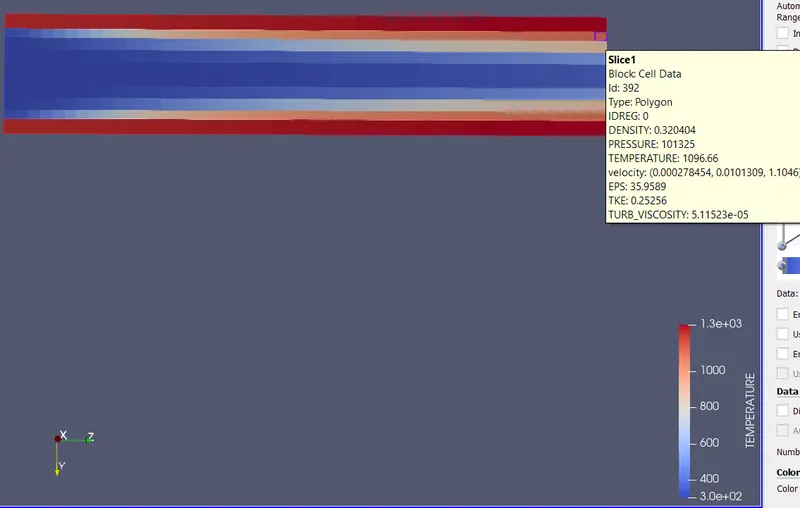
For mesh size = 0.004m
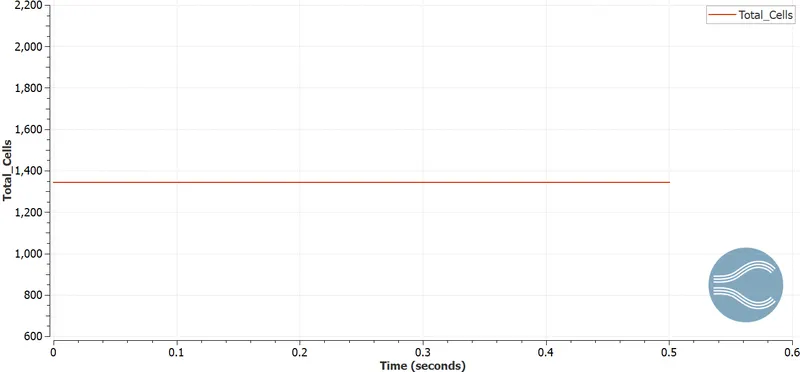
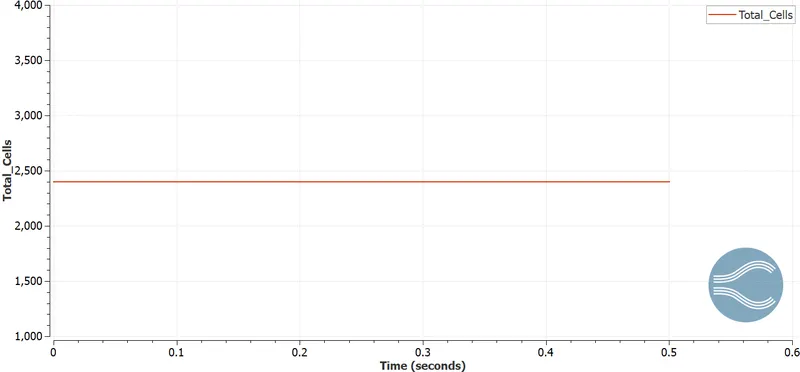
Total cell count
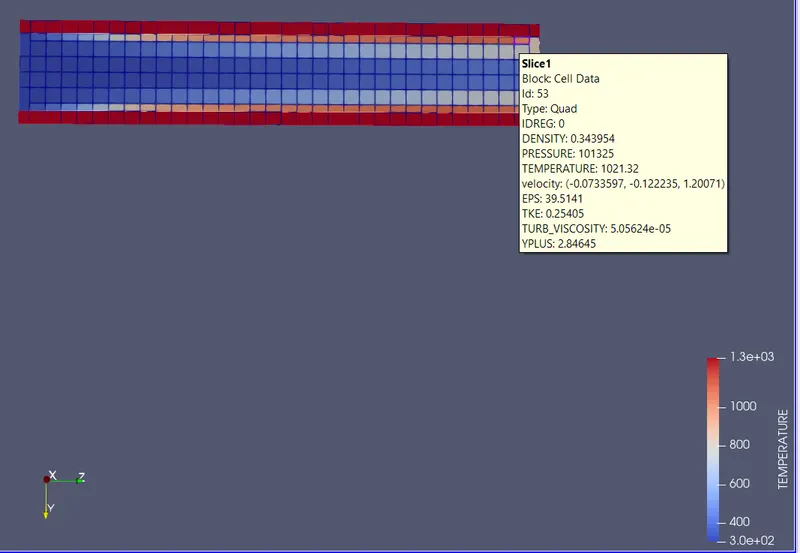
Temperature Contour
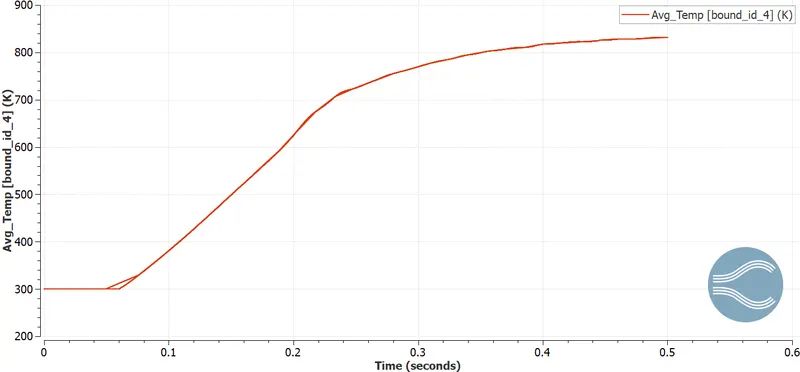
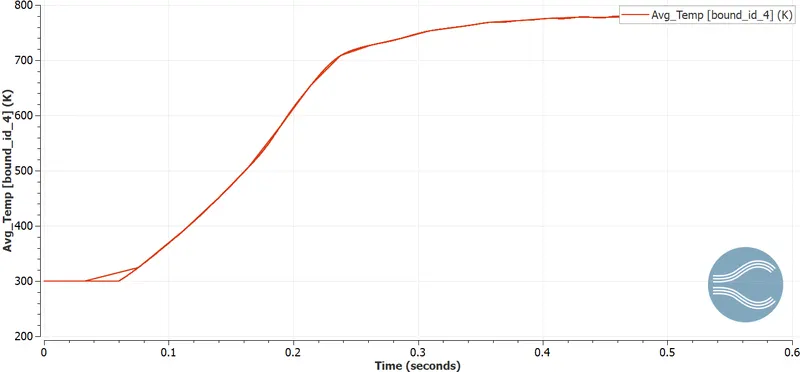
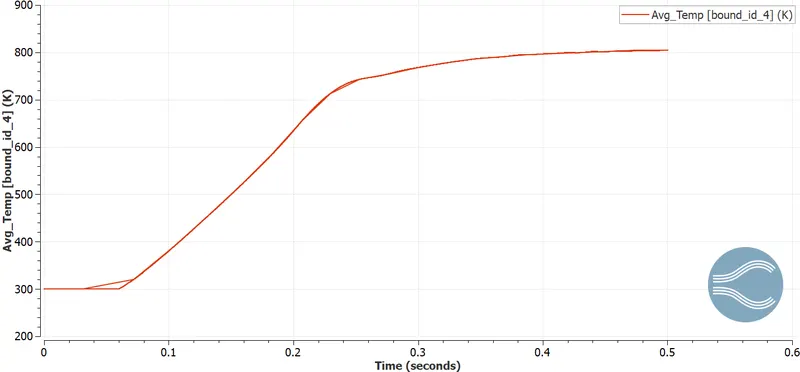
Avg. Temp Plot at the outlet
For Mesh size = 0.006m
Total cell count
Mesh
Temperature Contour
Avg Temp plot at the outlet
Results
For mesh size = 0.005m
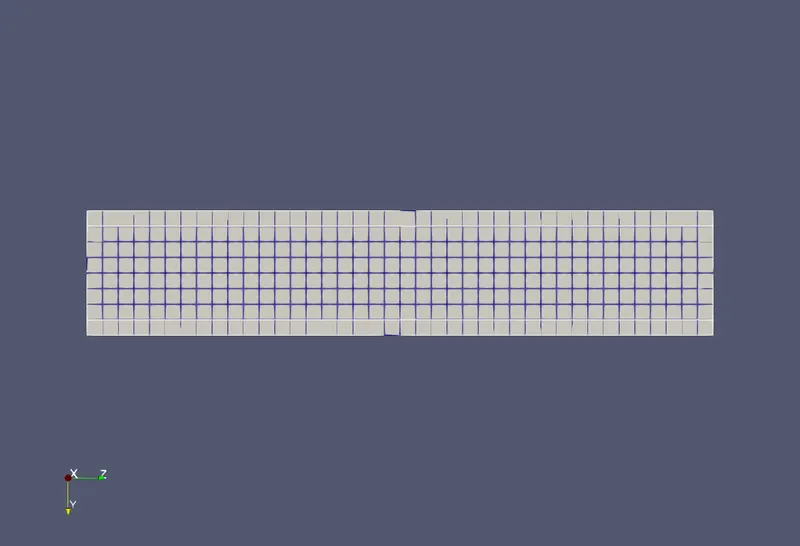
Total Cell count
Mesh
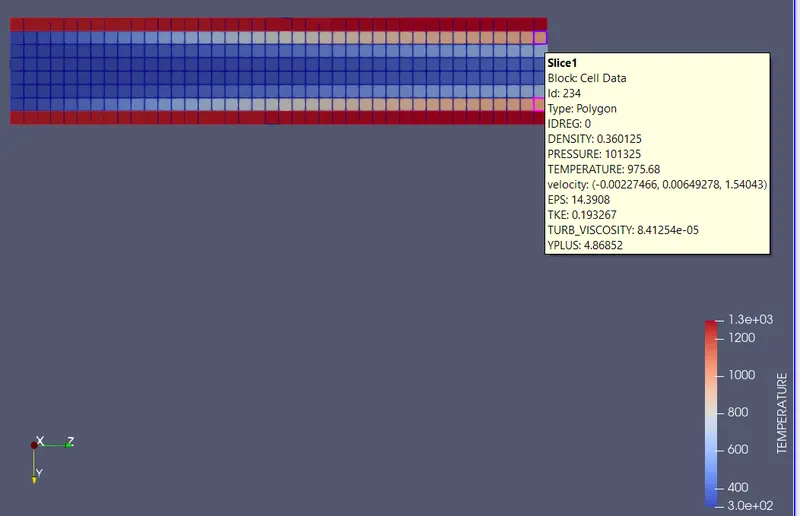
Temperature
Avg Temperature Plot at the outlet
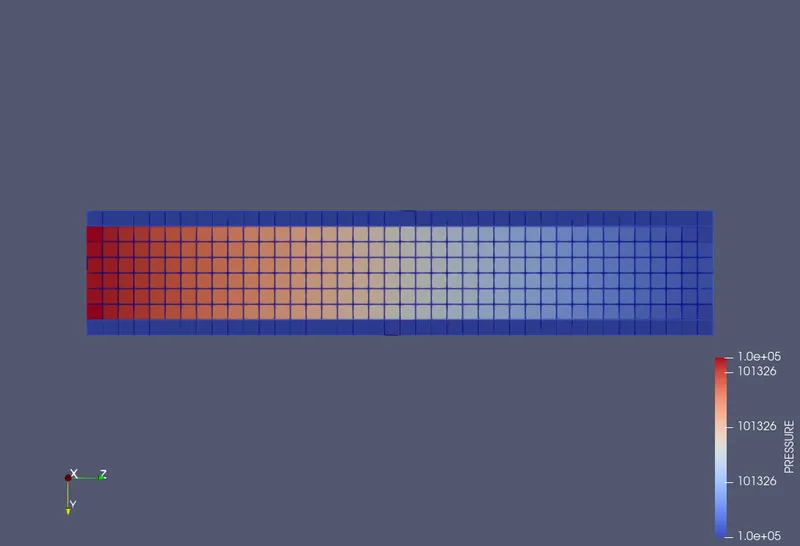
Pressure
Velocity
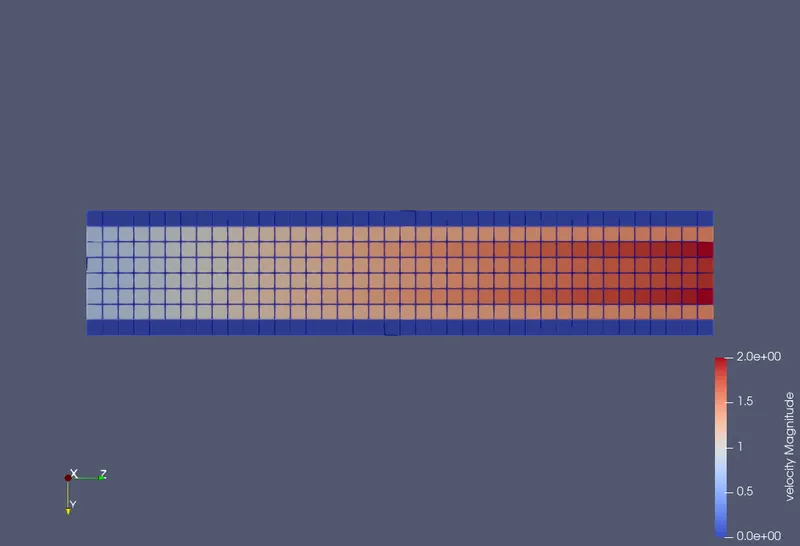
Animation
Results for Super cycle stage interval variations
For 0.01, results are displayed in above sections. All three simulations in various mesh size are carried out in 0.01 only.
For this simulations, mesh size has been jept at 0.05m.
For Super cycle stage interval = 0.02
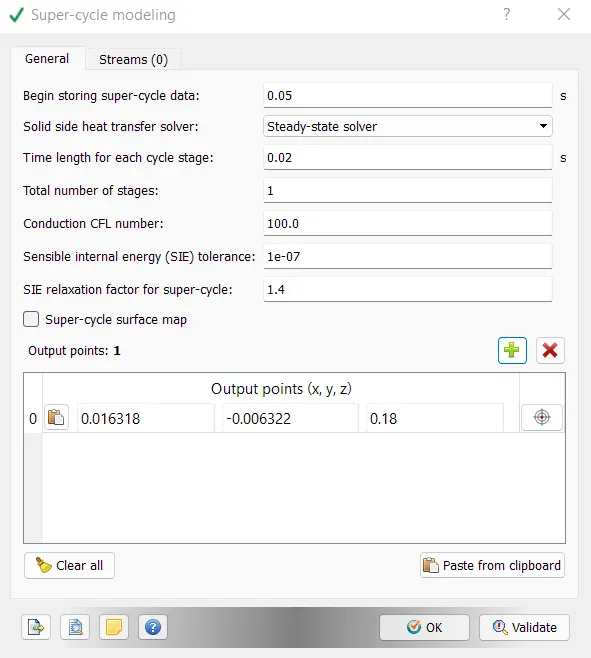
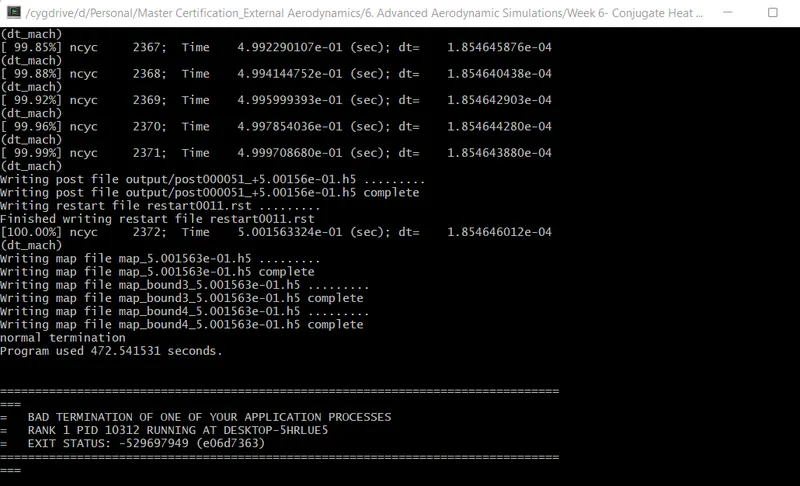
Total cell count
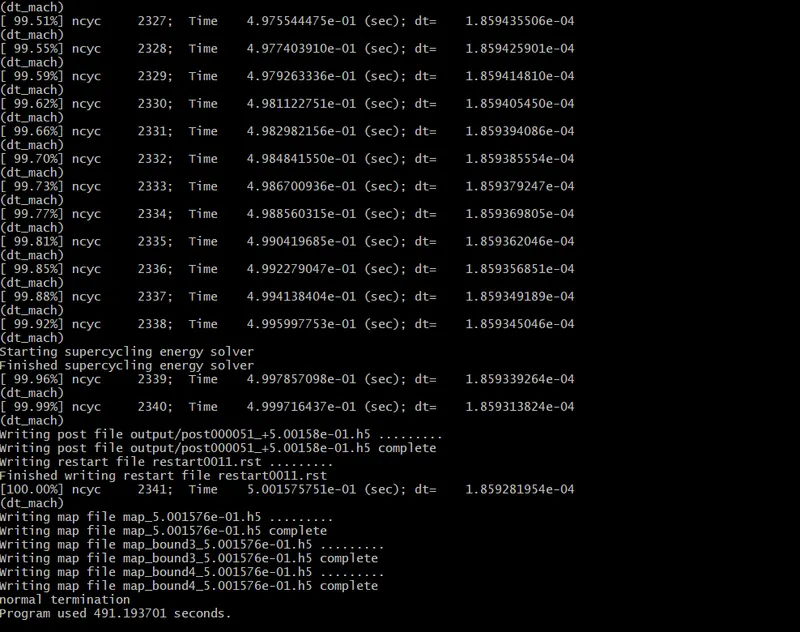
For Super cycle stage interval = 0.03
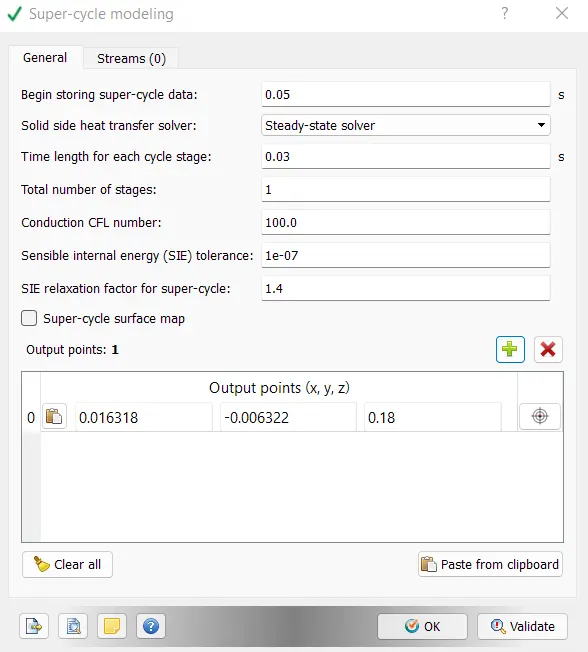
Total cell count
Temperature Comparision between different mesh sizes
| Mesh Size (m) | Temperature (deg C) |
| 0.004 | 832.08 |
| 0.005 | 804.9 |
| 0.006 | 778.7 |
From above table, it can be observe that the temperature difference between different meshes is increasing with the size of the mesh element. The 0.006m which is very coarse mesh shows the result with the higher difference with compare to 0.004m element size. But by considering the level of refinement implemented into the meshing, the results are satisfactory.
Total Simulation Time comparision between different supercycle stage interval
| Supercycle Stage Interval | Simulation time (sec) |
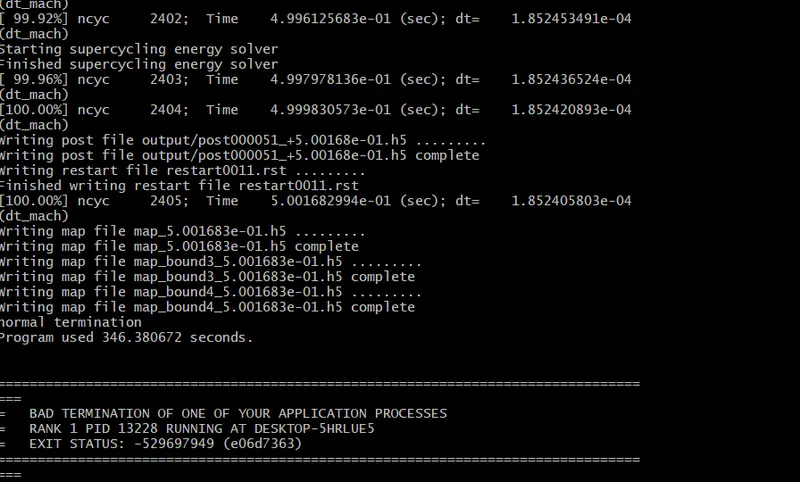
| 0.01 | 346.38 |
| 0.02 | 472.54 |
| 0.03 | 491.19 |
The simulation time is increasing with increase in supercycle stage interval.