Week 6 - CHT Analysis on a Graphics card
Objectives:
- Run the simulation by varying the velocity from 1m/sec to 5m/sec for at least 3 velocities and discuss the results.
- Find out the maximum temperature and heat transfer coefficient attained by the processor.
- Prove that the simulation has achieved convergence with appropriate images and plots.
- Identify potential hotspots on the model.
Inputs:
Materials -
1) Processor - Gold (Default Values)
2) Rest of the Graphics Card - Copper (Default Values)
3) Fluid - Air (Default Values)
Heat Generation in Processor:
Power = 1 W (Assumed)
Area = 64 m^3
Heat Generation Rate = power/Area = 1/(64X10^-6) = 15625000 W/m^3
Inlet velocity:
First case - 5 m/s
Second Case - 3 m/s
Third Case - 1 m/s
Preparing Model:
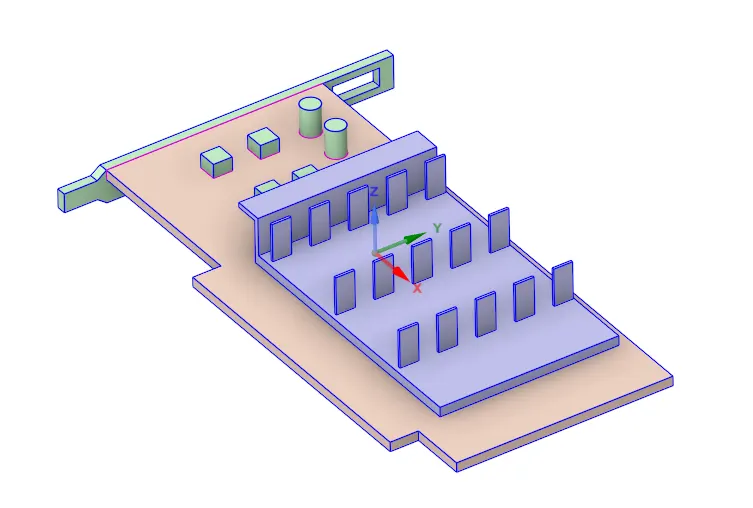
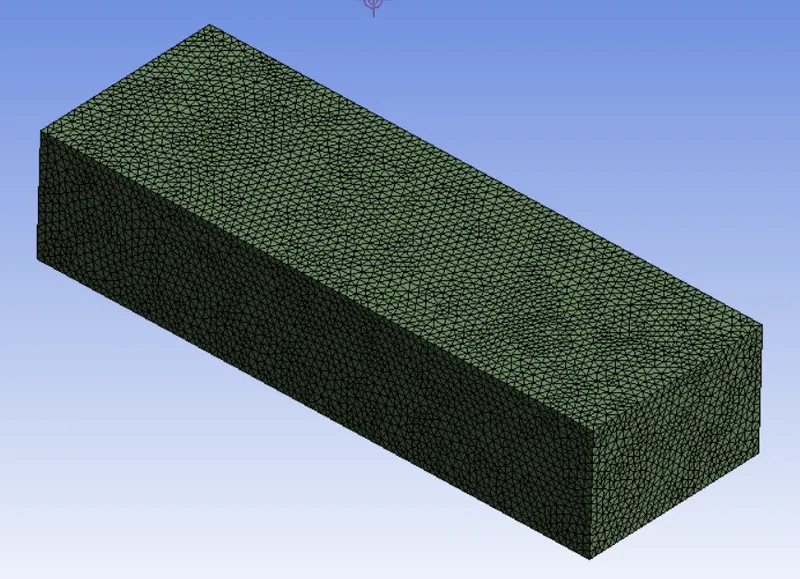
Received model has been prepared for simulation by performing shared topology which is neccessity for Conjugate Heat Transfer analysis. It improves in interpolating data bertween 2 adjucent elements. The image shows only graphics card, but shared topology has been performed between all models including enclosure.
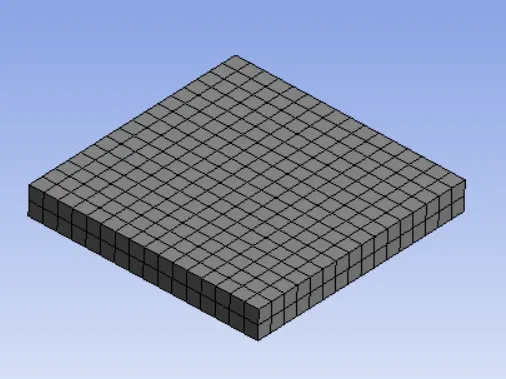
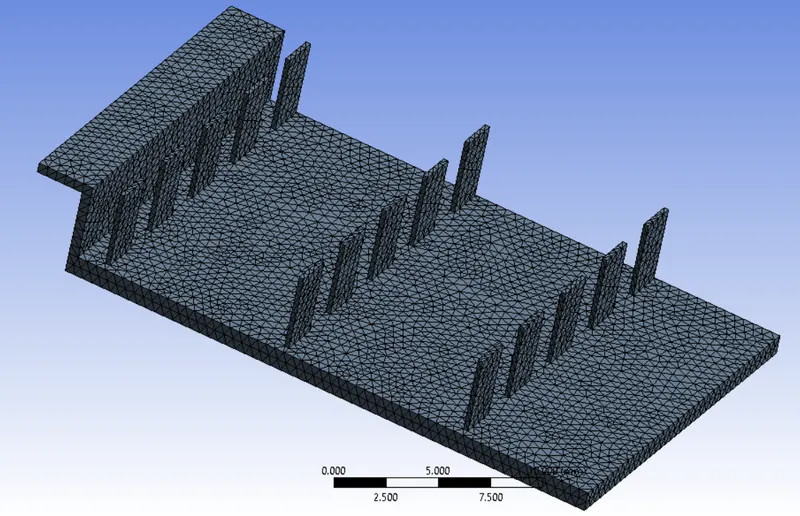
Mesh has been generated using following mesh element sizes:
Processor - 0.5 mm
Fins - 0.5 mm
Enclosure & Base - 2.5 mm
Total Elements - 479322
The fins & processor will be sensitive to heat transfer compare to other parts because processor is the source of heat while the fins will be responsible to dissipate more heat from the processor to maintian the maximum temperature of the processor.
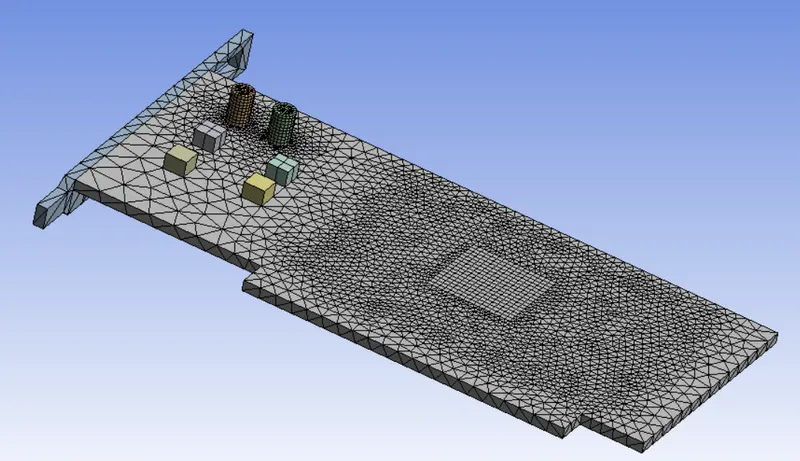
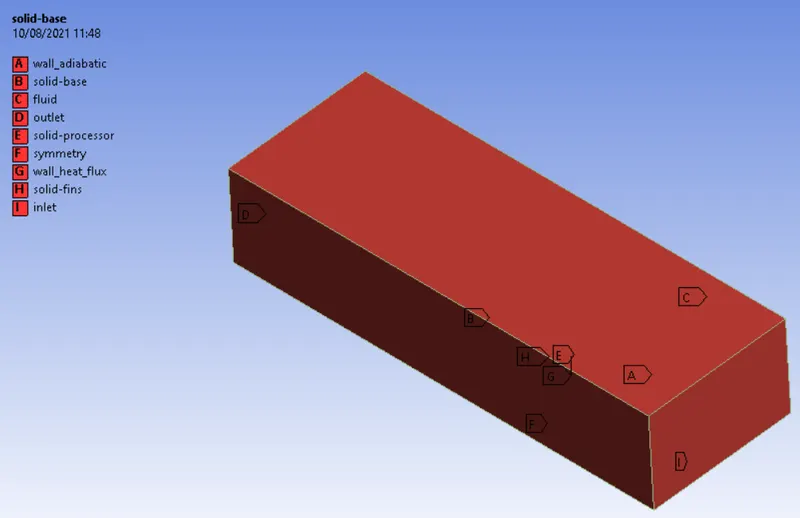
Different naming has been given to different faces.
Simulation Setup:
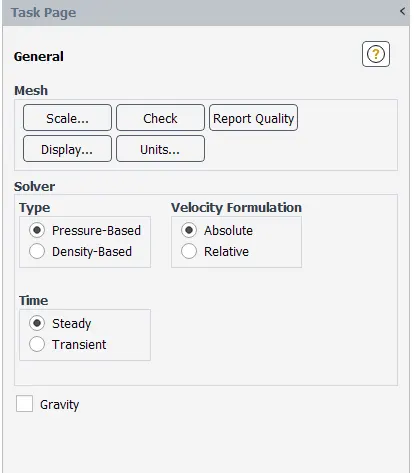
Turbulence Model -
k-omega SST model
Energy - On
Materials:
Processor - Gold (au)
Fins & Base - Aluminium (Al)
Fluid - Air
All materials has been considered with default vlaues.
The processor has been defined as the source of heat. The heat generation rate, which is calculated before, has been inserted in the following way.
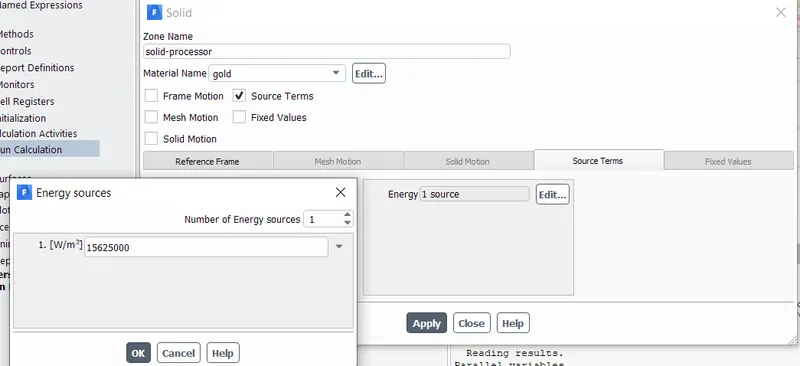
Following inlet velocities has been considered - 1 m/s, 3 m/s & 5 m/s
Initialization Method - Hybrid
Solutions:
Q. Run the simulation by varying the velocity from 1m/sec to 5m/sec for at least 3 velocities and discuss the results.
1) 5 m/s Velocity
Temperature Distribution Contour Graph:
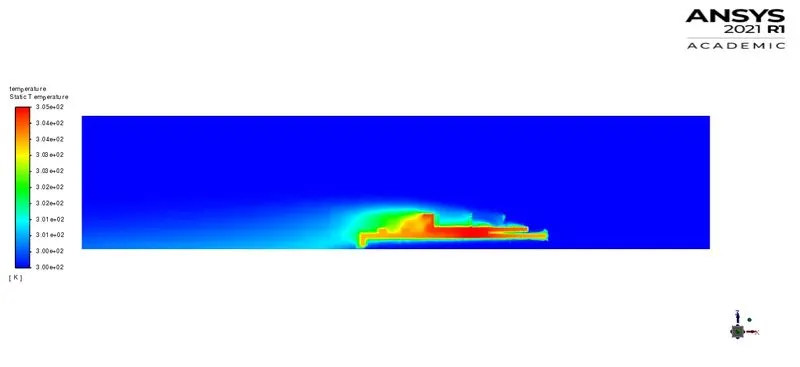
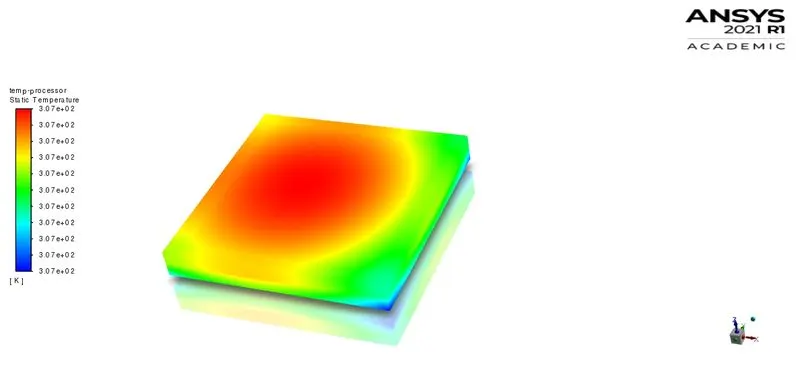
Temperatur Graph - Processor
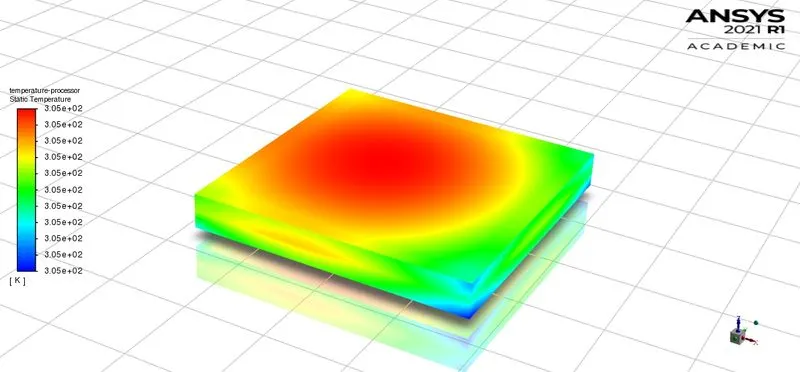
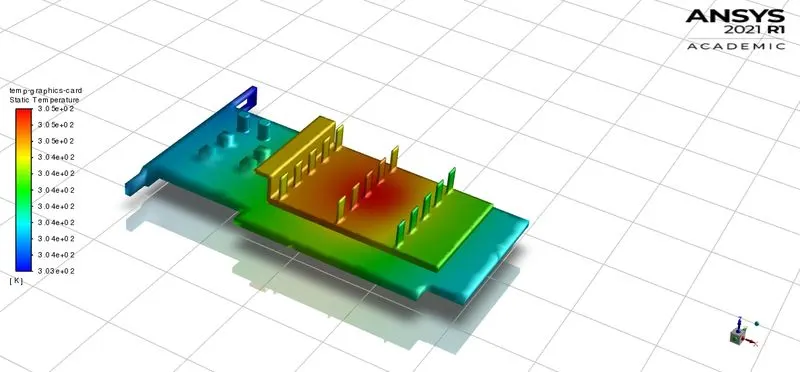
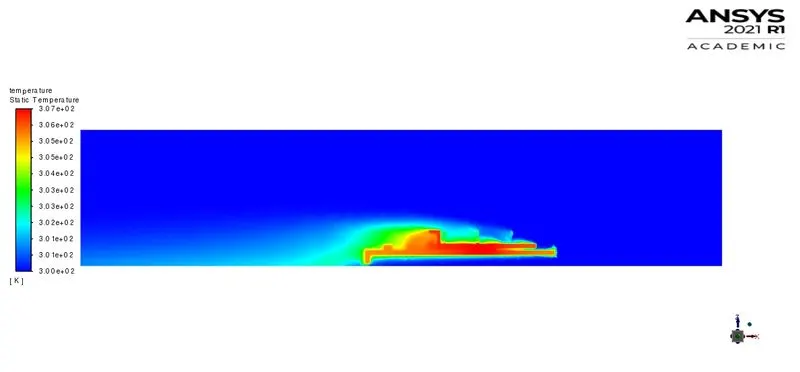
Temperature - Graphics Card
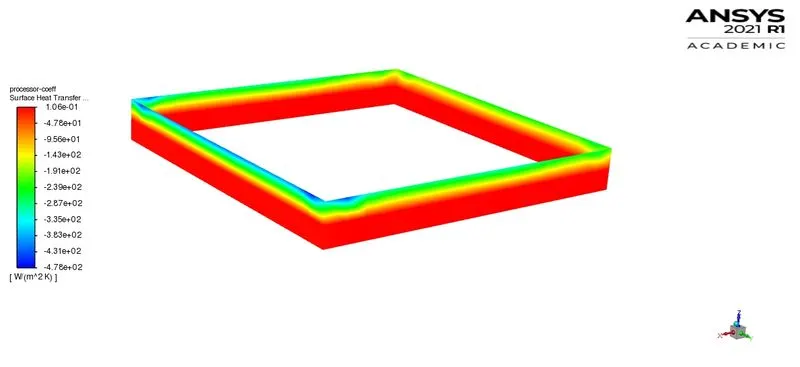
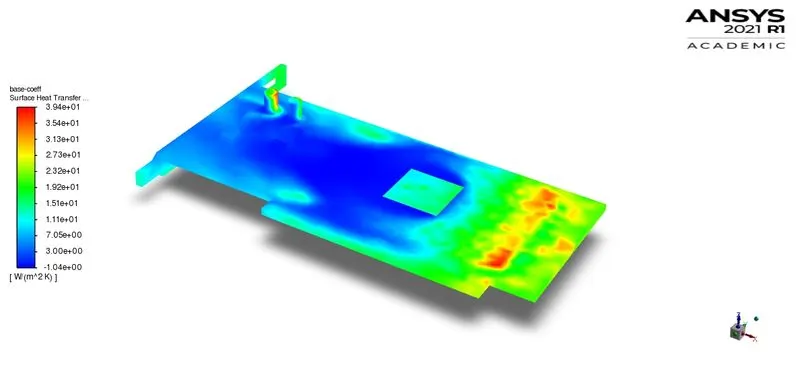
Surface Heat Transfer Coefficient plot of Processor side surfaces:
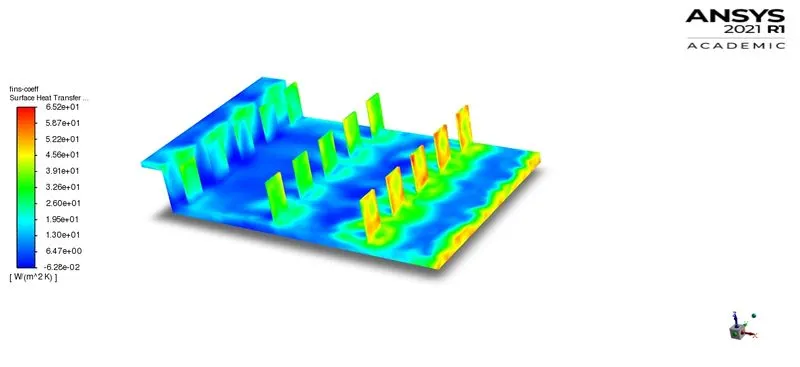
Heat transfer coefficient graph for fins & base:
2) 3 m/s velocity:
Temperature Distribution
Temperature Graph - processor
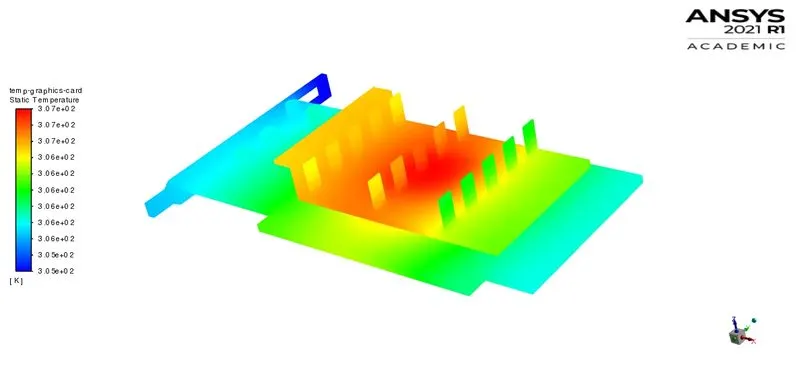
Temperature - Graphics Card
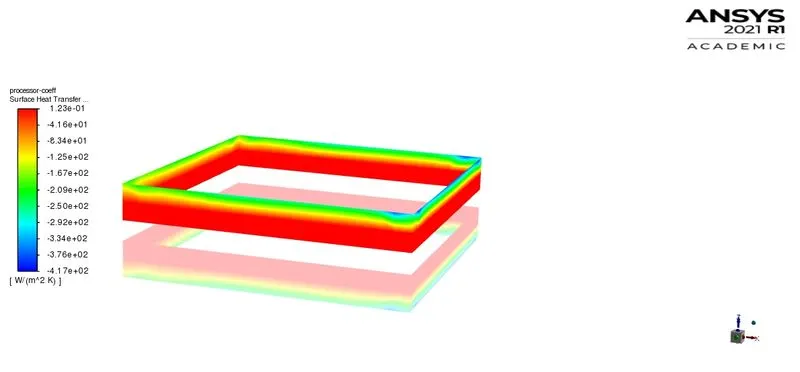
Heat Transfer coefficient - processor
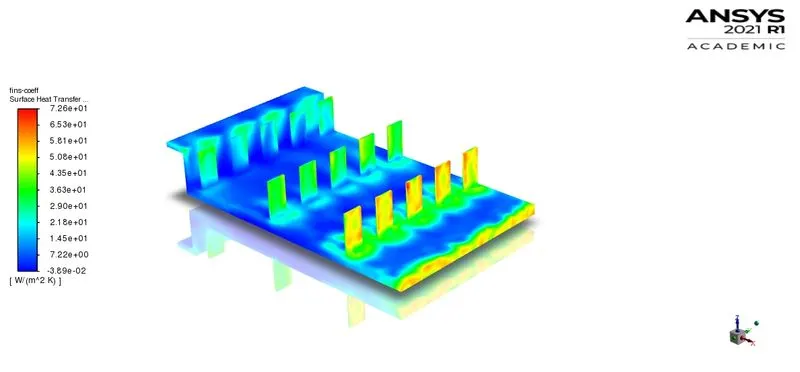
heat transfer coefficient - fins
3) 1 m/s velocity
Temperature Distribution
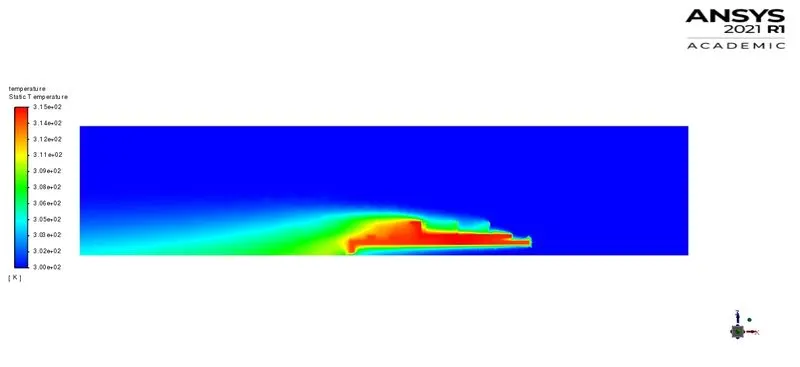
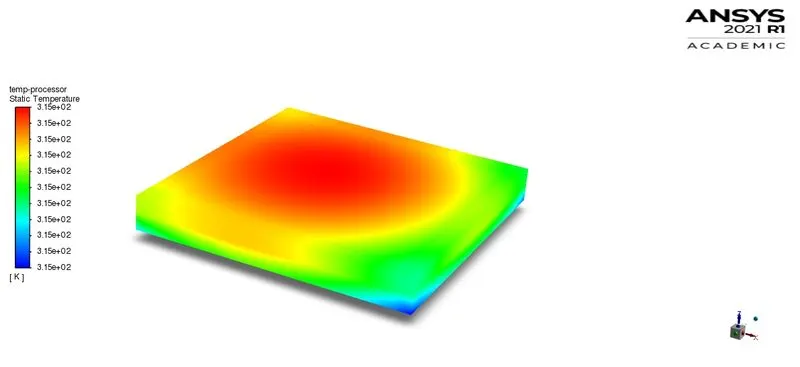
Temperature Graph - processor
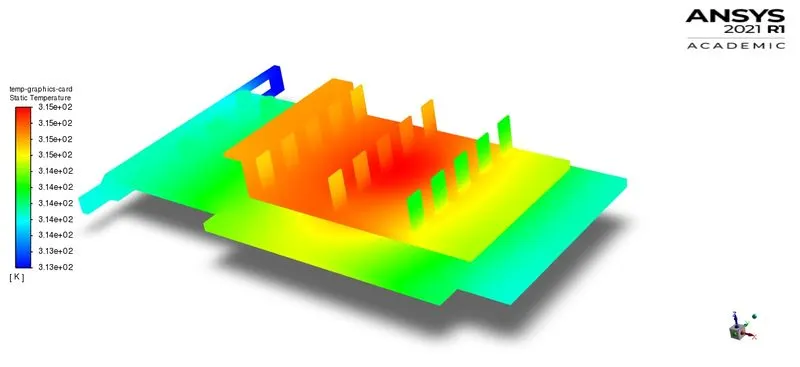
Temperature Graph - Graphics Card
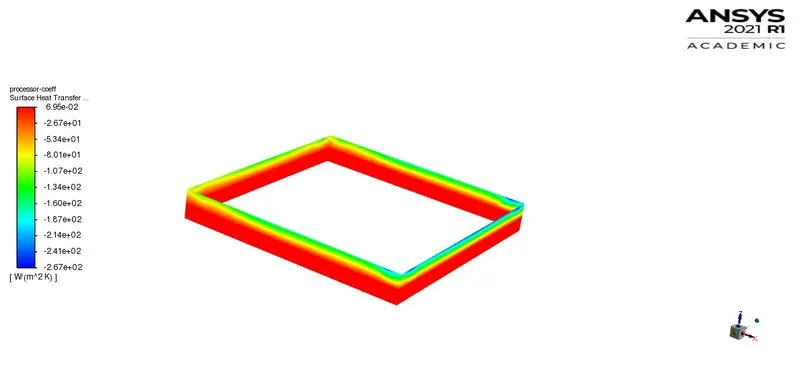
Heat Transfer Coefficient - processor
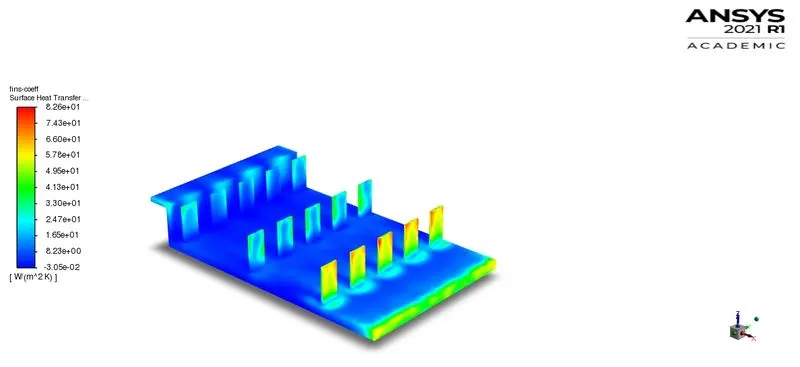
Heat transfer Coefficient - fins
Results Discussion:
For all three simulations, the graphs for temperature & heat transfer coefficient for the processor, fins & whole graphics card has been displayed. The maximum temperature of processor has been decreasing with increasing air velocity because with increasing air velocity, heat transfer coeffcient has also been increased. If heat transfer coeffcient is higher than the heat dissipation will increase rapidly as well which can be observed in above images.
Q. Find out the maximum temperature and heat transfer coefficient attained by the processor.
| Flow Velocity (m/s) | Maximum Temperature (C) | Heat Transfer Coefficient (W/m^2.K) |
| 5 | 305 | 0.106 |
| 3 | 307 | 0.123 |
| 1 | 315 | 0.007 |
From above table, it can be observed that the maximum temperature of processor is increasing with decrease in velocity speed and heat transfer coefficient was almost similar for 5 m/s & 3 m/s air flow velocity case, but for 1 m/s, heat transfer coeffcient has been decreased drastically & similar phenomena also can be seen in maximum temperature values as well.
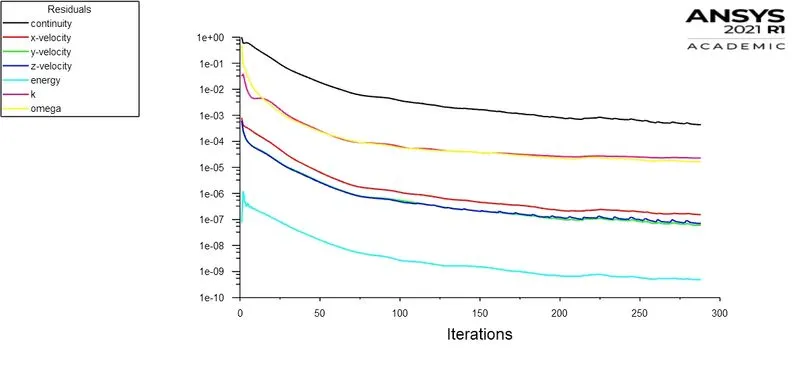
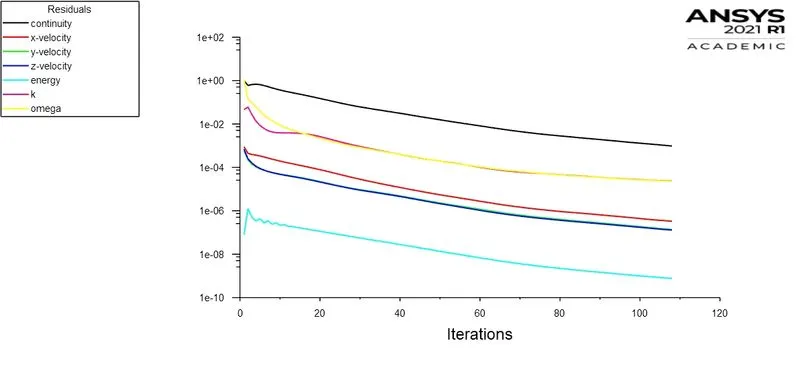
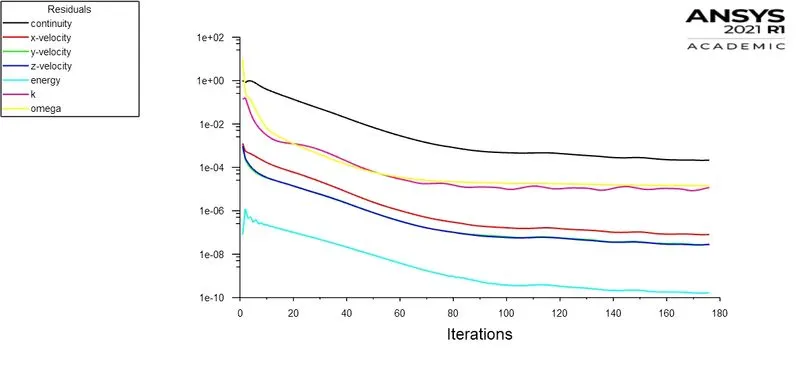
Q. Prove that the simulation has achieved convergence with appropriate images and plots.
The convergence can be achieved when the errors either fall consistantly or remain steady without any sudden increase or decrease in their values with iterations below set limit of maximum allowable error for each term.
For 5 m/s
For 3 m/s
For 1 m/s
Q. Identify potential hotspots on the model.
From the temperature distribution plot, it can bee seen that the components of graphics card like fins & base has the highest temoperature compare to any other region. The potential hot spots in the model are from where heat is transferring from processor to fins & the area near by that place in fins can be considered as hot spots.