Week 6 - CHT Analysis on a Graphics card
OBJECTIVE OF SIMULATION:
- Run the simulation by varying the velocity from 1m/sec to 5m/sec for at least 3 velocities and discuss the results.
- Find out the maximum temperature and heat transfer coefficient attained by the processor.
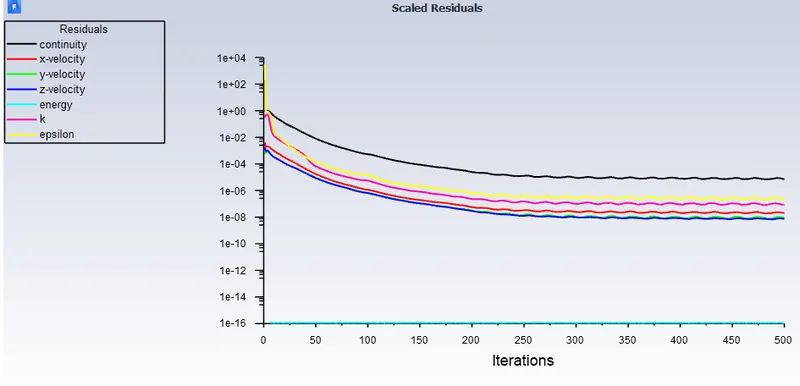
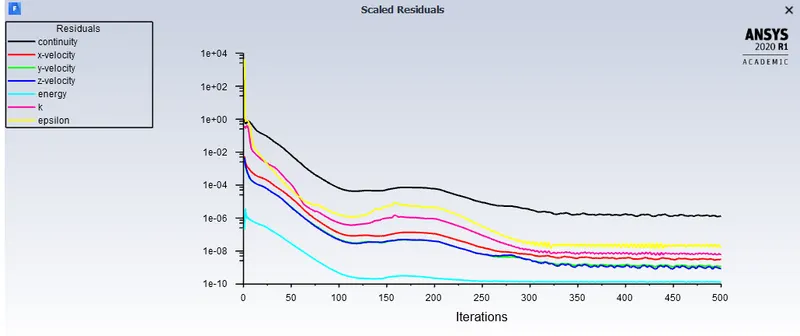
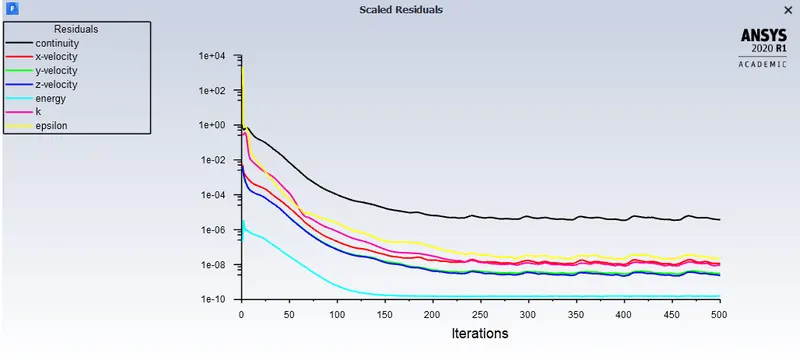
- Prove that the simulation has achieved convergence with appropriate images and plots.
- Identify potential hotspots on the model.
THEORY:
Modern-day computing is all about miniaturization, the processors and graphic cards available today, perform complex computations with very little time. In order to run these operations, energy is involved, when energy is involved heat generation is unavoidable. Through CFD we can optimally plan our chip cooling systems and component placement, which greatly improves the life and the efficiency of the component. In modern PCB, the cooling is done through Fins, they are structures that increase surface area for cooling.
The heat generated from the processor is conducted through the fins, and from the fins, the heat is convected, hence maintaining optimum temperature.
INLET CALCULATIONS:
1. The inlet velocity is taken to values close to 2m/s, since cooling fans produce that much velocity. For our simulation, we have taken 2, 2.5, 3m/s.
2. From references a 2Gb graphic card requires 75W of power, out of which 99% is heated, sizing it to our dimensions that is 8mmx8mmx1mm, we take the heat generation capacity as 2.3437e7 W/m^3.
GEOMETRY SETUP & MESHING
1. Import the geometry in SpaceClaim, since it has been adjusted for an academic license, we just go to the share option in the workbench so that we get sharing topology.
2. We proceed with meshing, the details of the mesh are shared below. Before that giving appropriate named selections.
CASE-I ( Baseline mesh) Velocity is 2m/s
Global mesh-10mm
PCB Body-1mm (Body sizing)
Processor-1mm(Body sizing)
Fins-1mm (Body sizing)
CASE-II ( Baseline mesh) Velocity is 2.5m/s
Global mesh-5mm
PCB Body-1mm (Body sizing)
Processor-0.5mm(Body sizing)
Fins-0.5mm (Body sizing)
CASE-III ( Baseline mesh) Velocity is 3m/s
Global mesh-10mm
PCB Body-1mm (Body sizing)
Processor-0.5mm(Body sizing)
Fins-0.5mm (Body sizing)
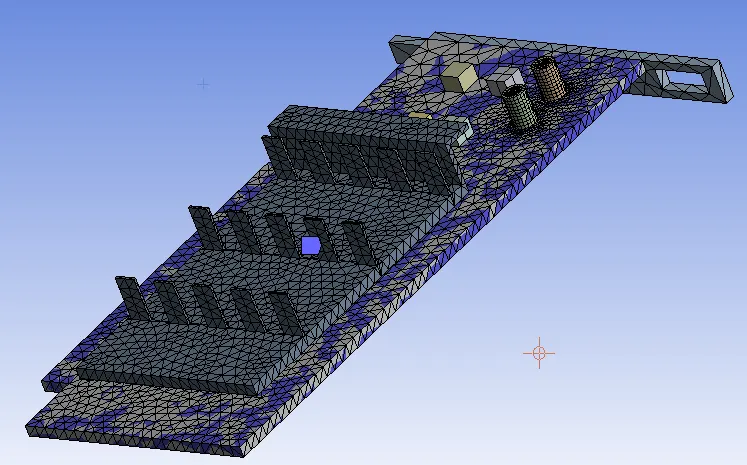
The geometry
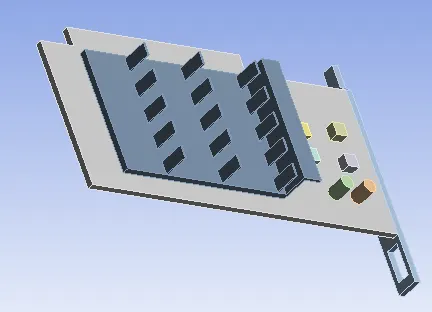
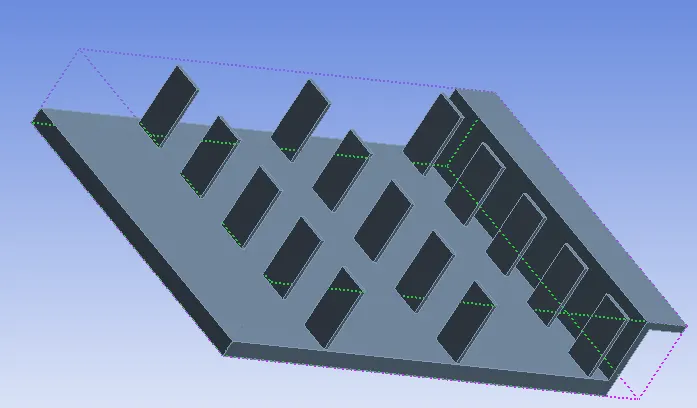
Fins and processor assembly
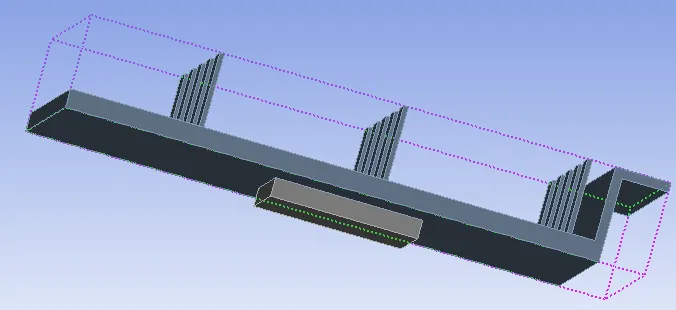
Fins that have projections that increase surface area.
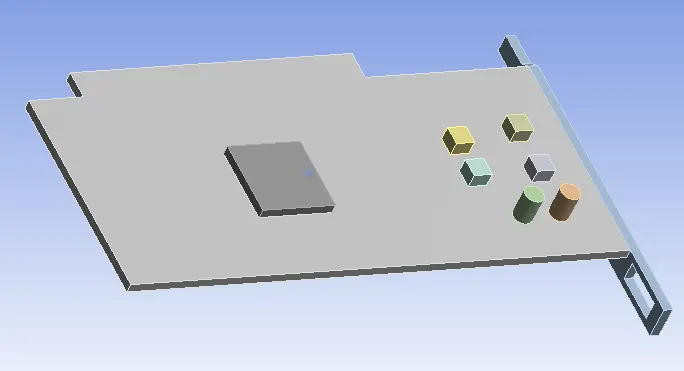
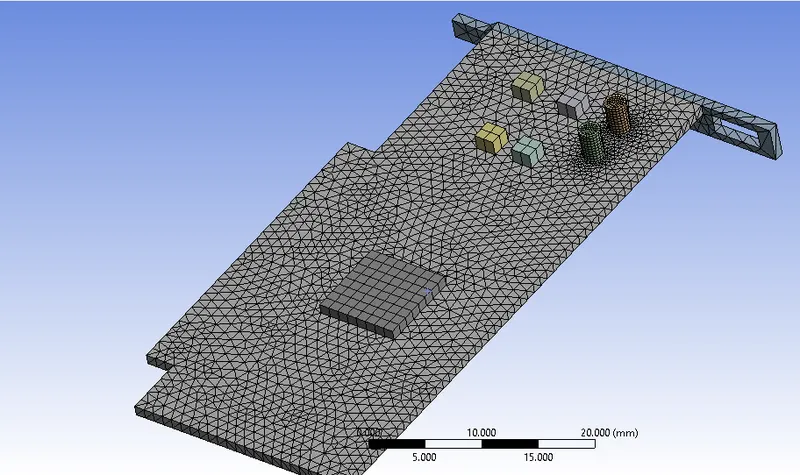
The processor and board assembly.
The baseline mesh velocity 2m/s
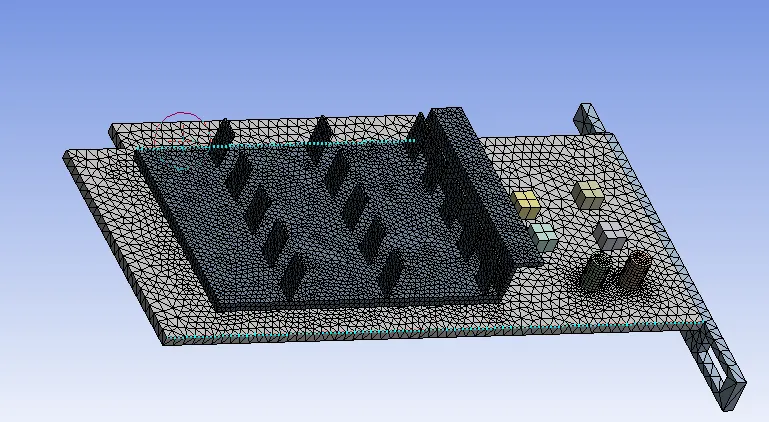
A finer mesh which has been used for both cases (Could not go finer since license restrictions)
SETUP:
1. Using pressure-based, steady-state solver.
2. The materials assigned are aluminum for fins, Silicon for the processor, FR-4( Glass reinforced epoxy laminate). The materials selected are from references.
3. Silicon:
Density-2000, Heat capacity- 710, Thermal conductivity- 150.
FR-4:
Density-1850, Heat capacity-950, Thermal conductivity- 0.29.
4. In cell conditions, ensure to enable processor as the source term, with the calculated value of heat generation capacity.
5. Set the inlet to the respective velocities.
6.Hybrid initilization & run for 500 iterations.
RESULT'S, OBSERVATION & DISCUSSION:
CASE-I ( BASELINE)
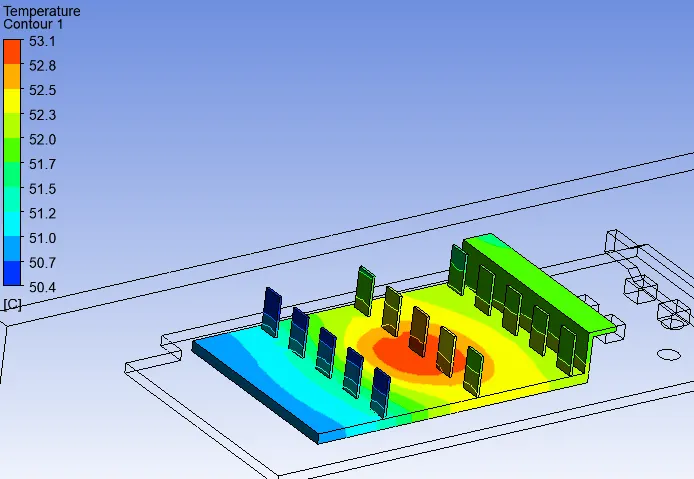
As we can see from the figure, the hottest part is in the center of the fin, just above the processor, the coolest part is the front part, and the rear parts are hotter because the cool air on absorbing heat cannot create the convective differential, requires for more cooling.
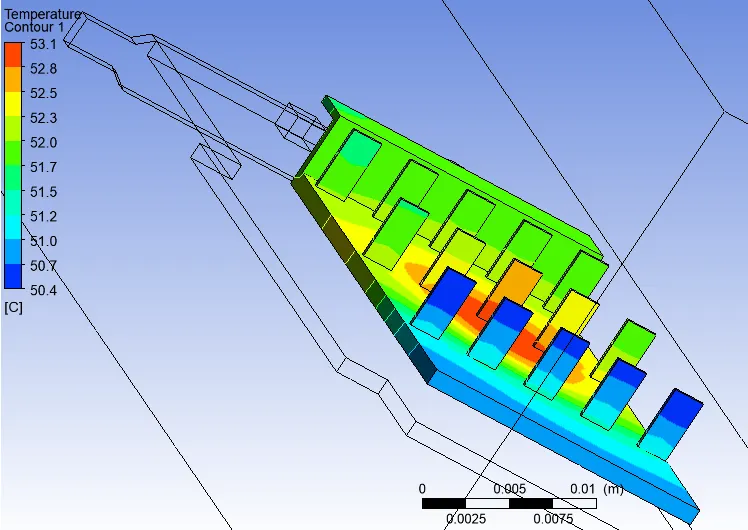
If we see the sides of the fins are much cooler than the center as most air is directed sidewards, than through the center.
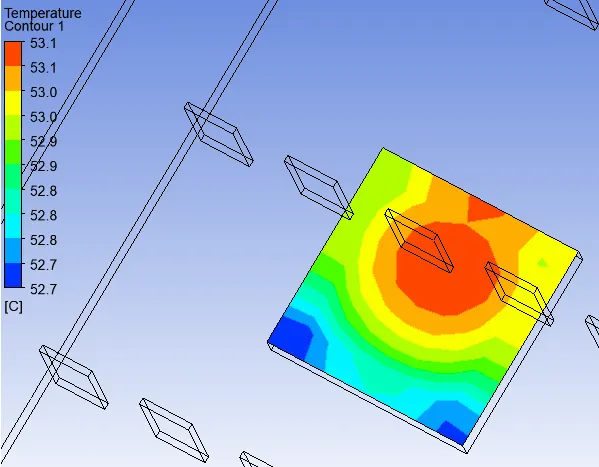
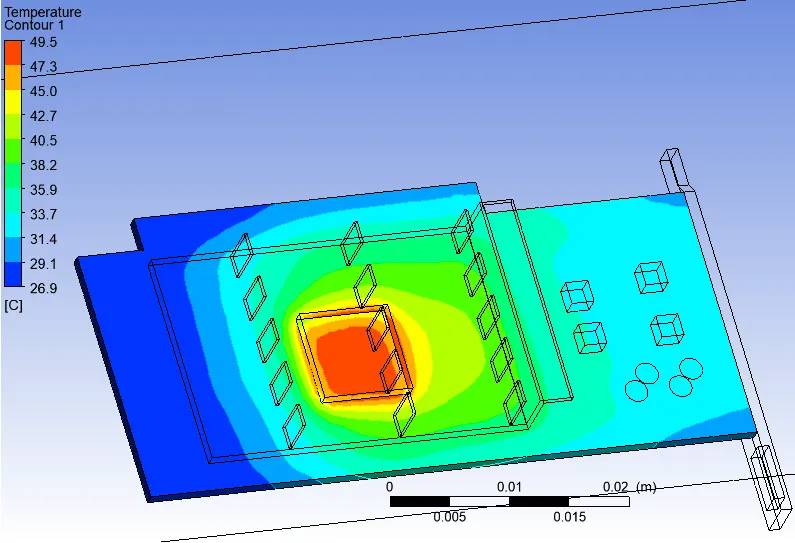
As we this the heat map of the processor, the major heated up part is about in the back part as previously mentioned the back fins do not provide that much cooling, the front part is a bit cooler as the front fins are more effective in cooling.
On the backside of the PCB board, we see a region of high temp not a hot spot, the reason being mesh is coarse.
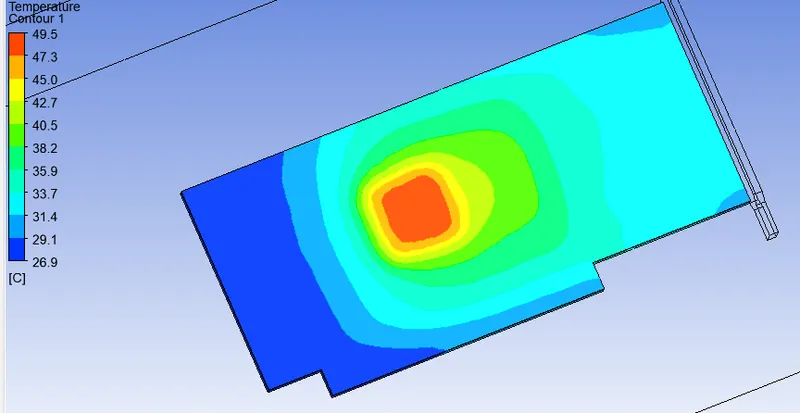
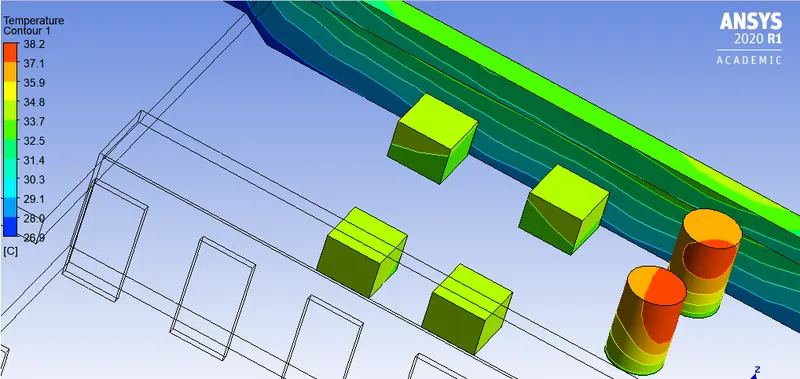
The backside components, like capacitors, have to be carefully kept as this region still is experiencing warm air, as air has convected some heat in the front, thermally sensitive devices must be refrained from placing.
Also, heat-generating devices should also be refrained to be placed there as cooling, which might be dampened.
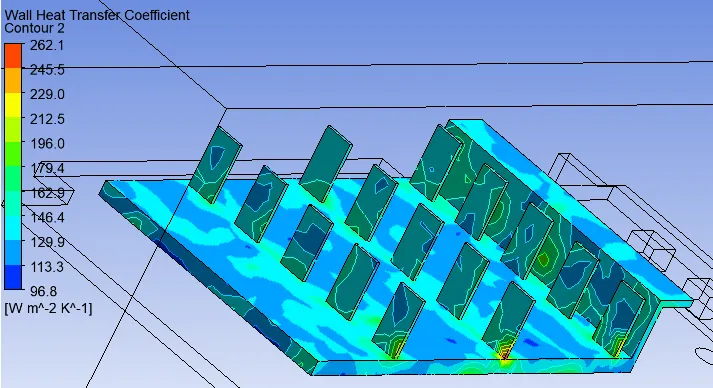
The HTC over the fins. We can see the fin tips having high HTC, some topological changes are required.
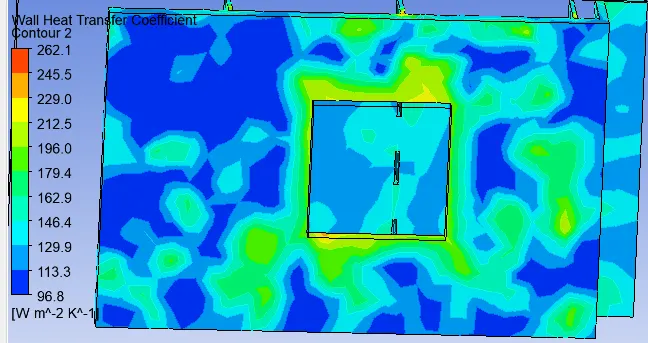
We can see that it appears to be very, patchy clearly a mesh problem
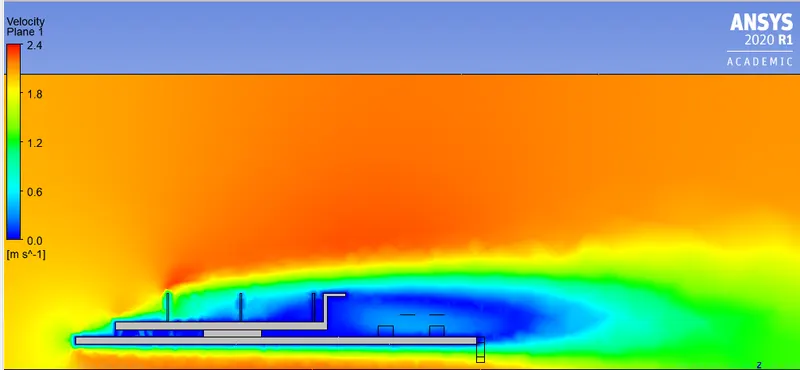
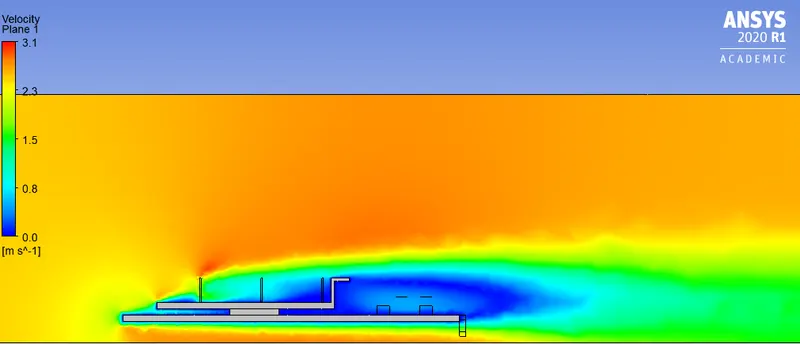
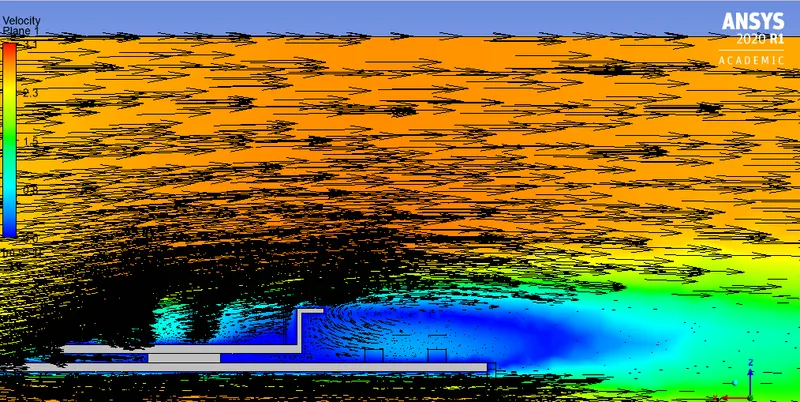
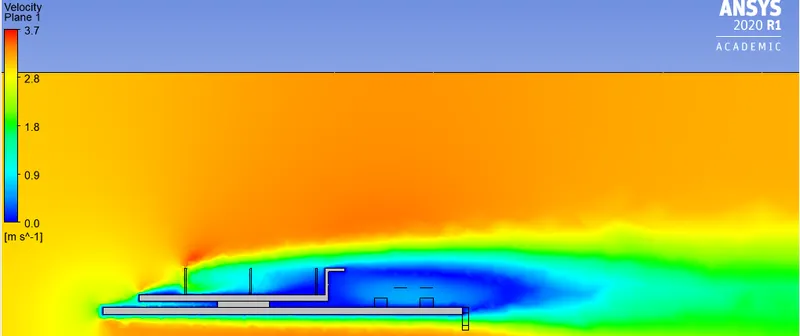
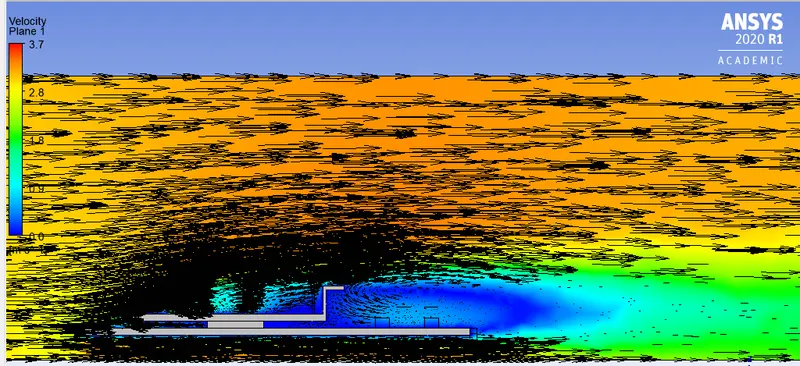
As we can see a recirculatory region is formed at the back.
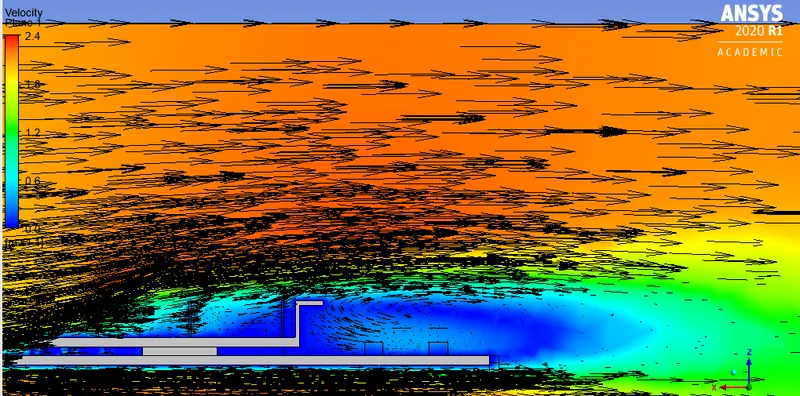
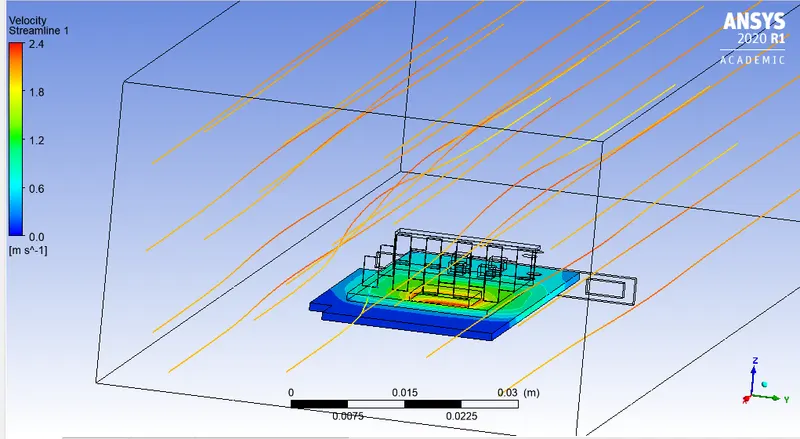
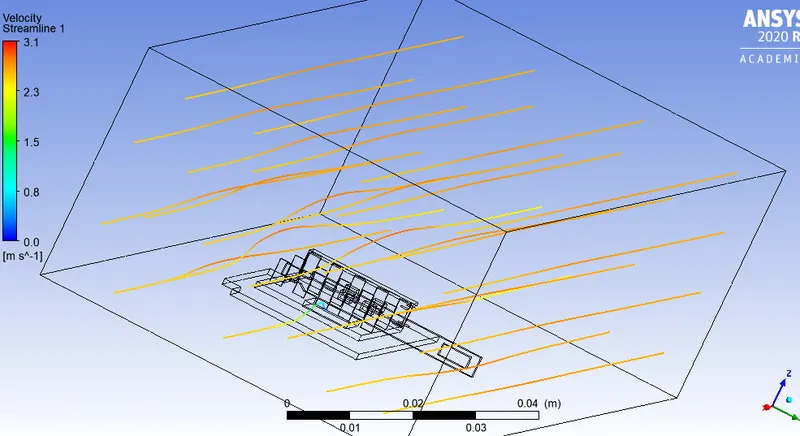
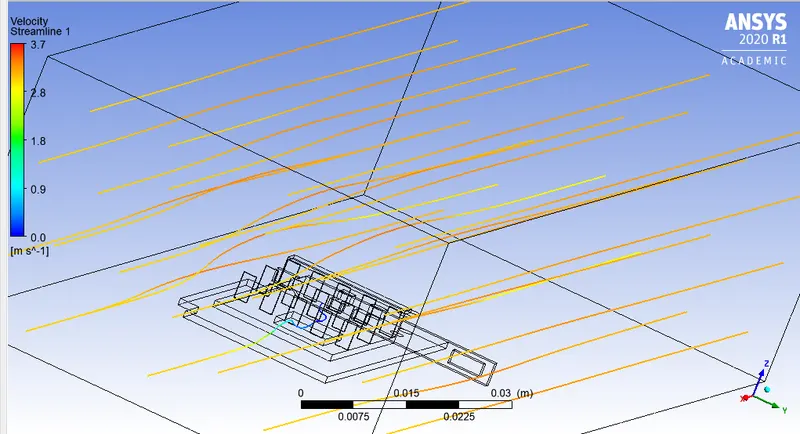
Streamlines showing the air passage more to the sides than the center.
CASE-II ( Velocity is 2.5m/s)
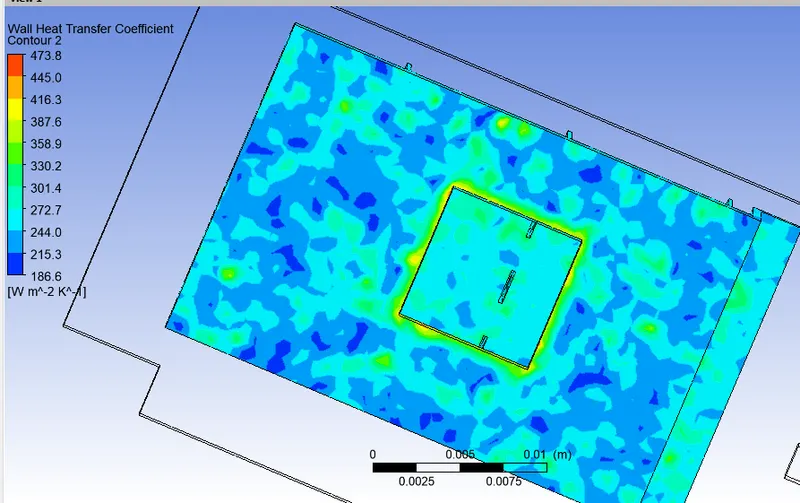
The difference we notice in a finer mesh is that the HTC values are more precise, also the regions of temperature are much more defined and demarcated.
The regions show a more detailed temperature map, with a bigger cool region in the front.
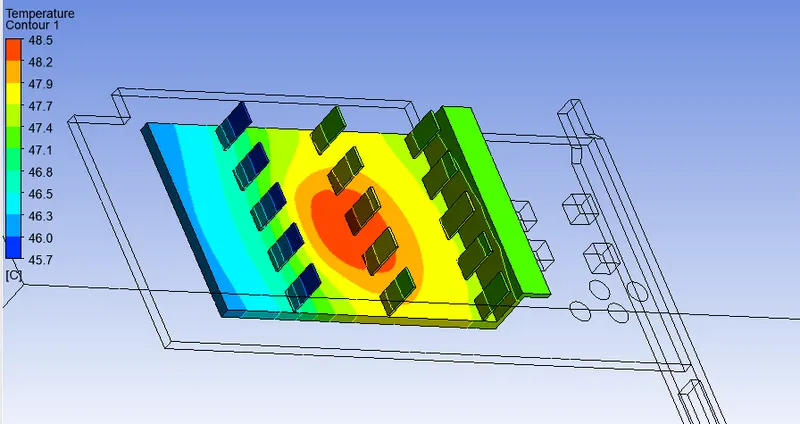
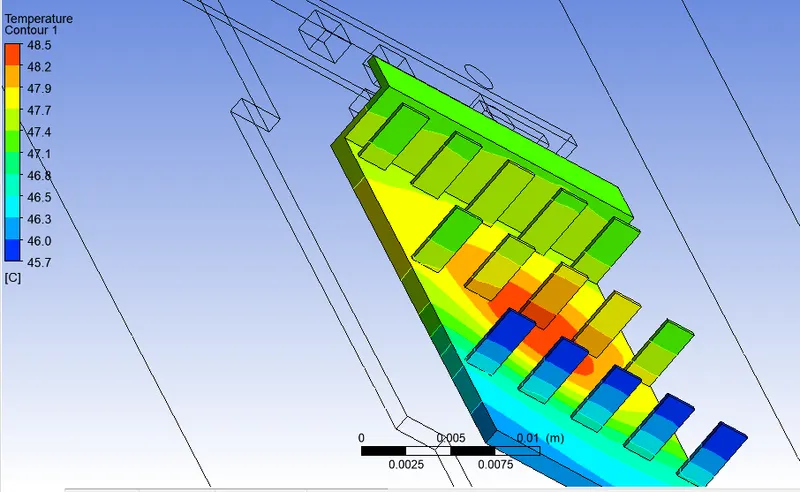
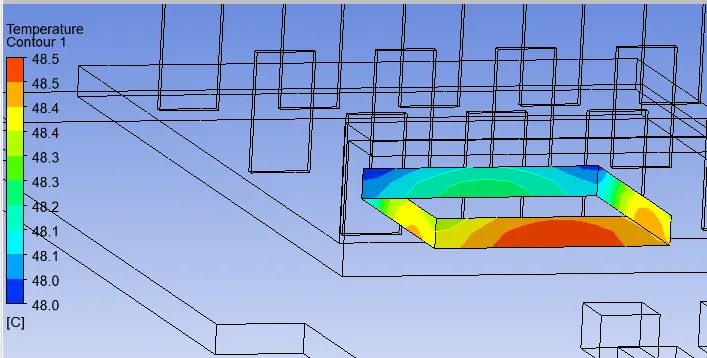
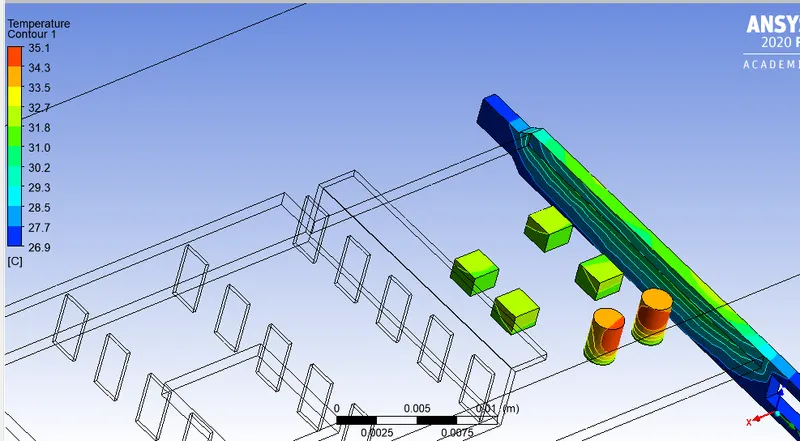
We can clearly see the hotspot now, it's at the rear bottom corner of the processor, care has to be taken about the fins above and no components must be placed directly down to this spot.
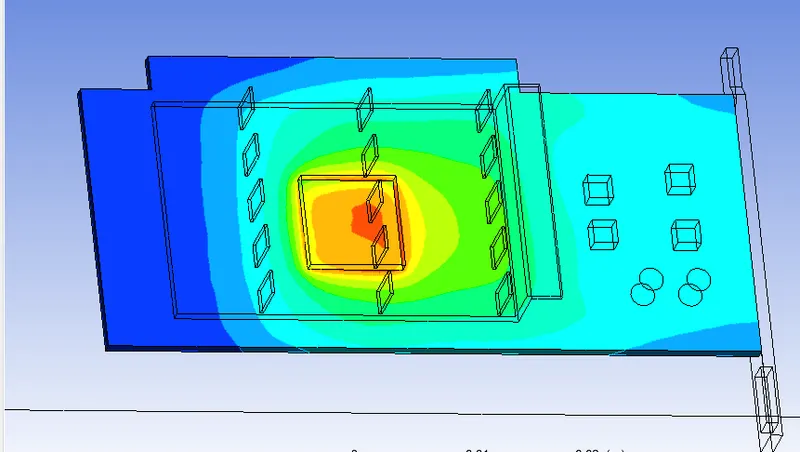
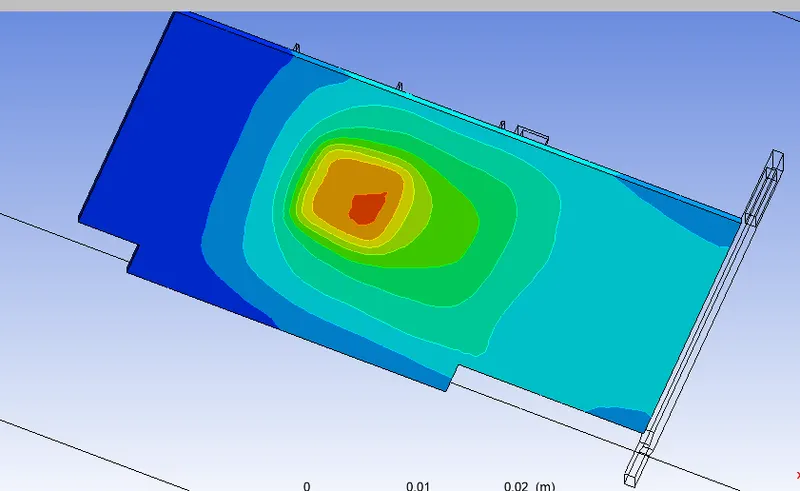
The processor shows a bigger hot region, at the rear, with max temperatures reduced to 48.5*C
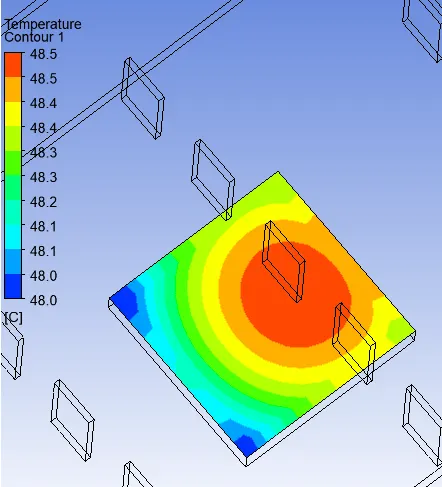
The processor wall showing high temperature at the rear wall.
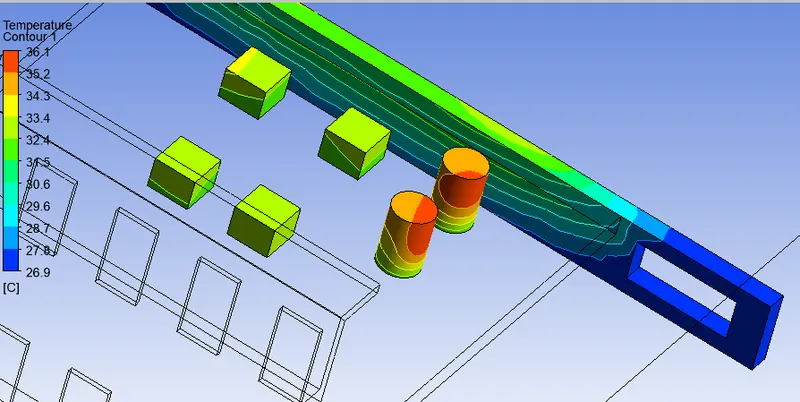
The max temperature at the recirculatory region now shows 36.18*C
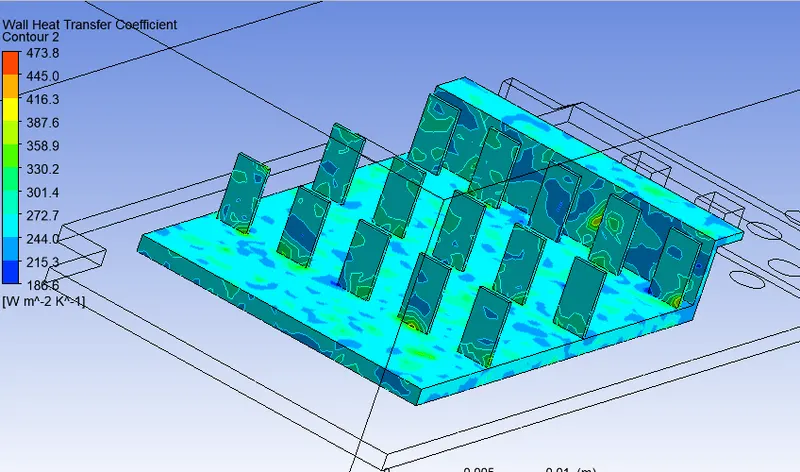
We can see that HTC is more uniform at the processor wall now due to mesh rectification.
CASE-III ( Velocity 3m/s)
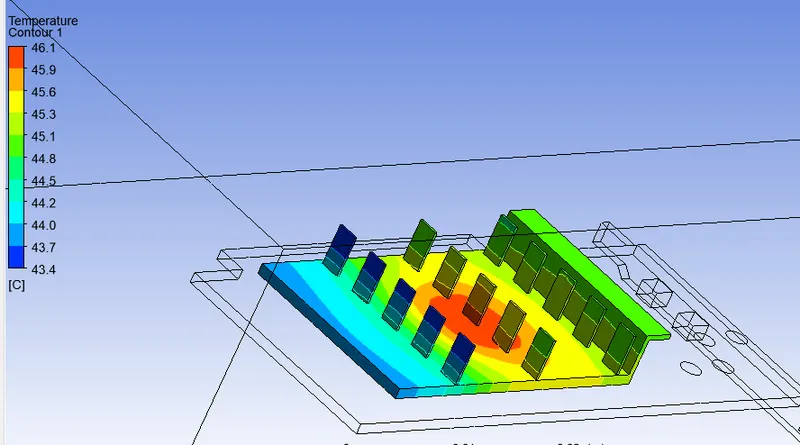
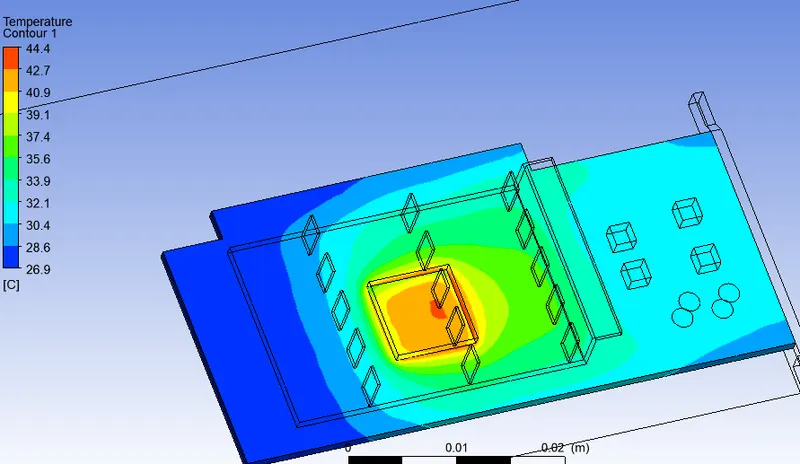
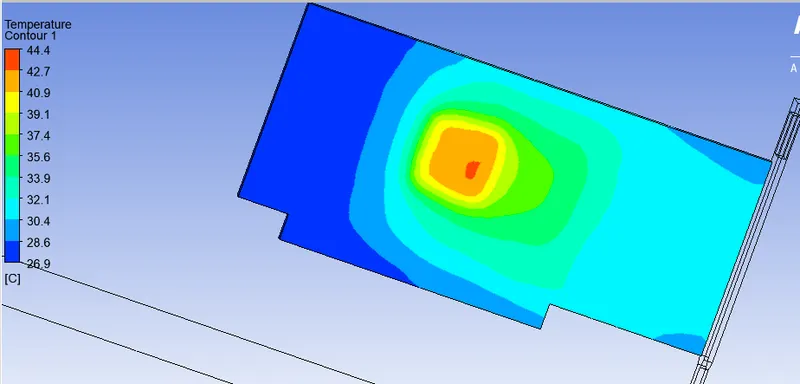
The hotspot very evident now.
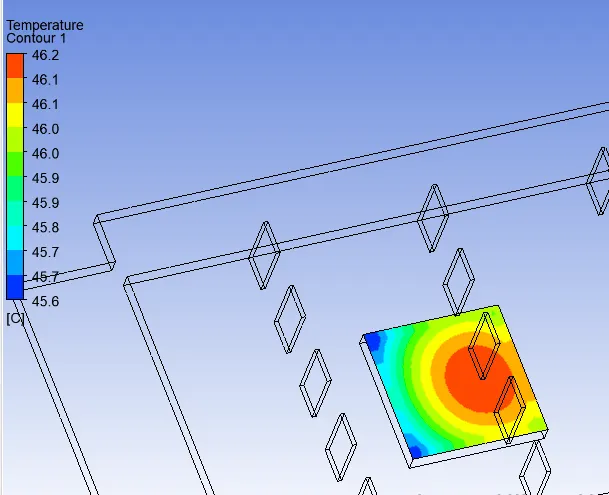
If we see from the heat flux map here, majority heat transfer occurs at the top where the fins are kept.
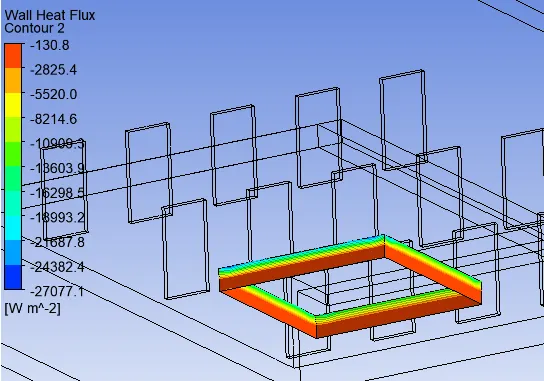
As we can see the major heat fluxes are at the front end and the sides of the fin, the centre shows a lesser flux.
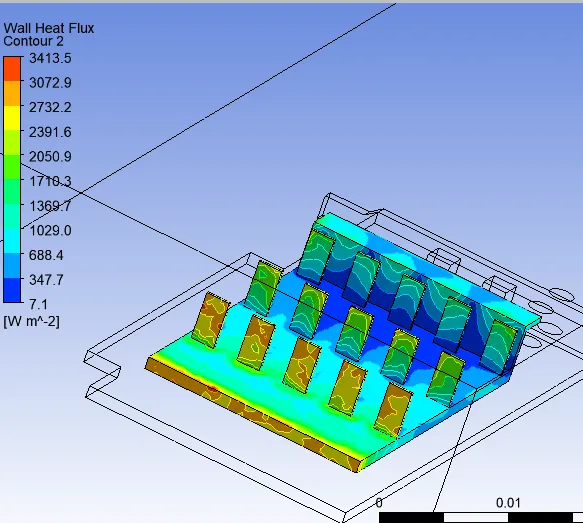
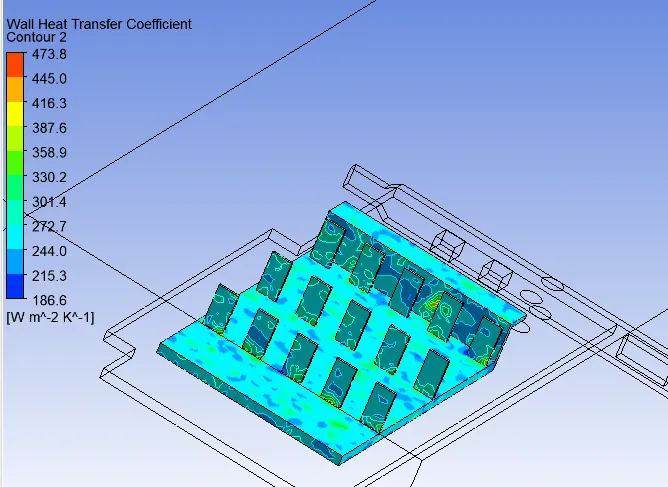
As we clearly see the recircualtory region causes the top part and the side faces of the back components to warm-up.
| CASES | MAX VELOCITY | MAX HTC | TEMP BY PROCESSOR | ELEMENTS | NODES |
| I-(2m/s) | 2.378 | 567.038 | 53.16 | 187675 | 33609 |
| II-(2.5m/s) | 3.0586 | 473.757 | 48.54 | 417580 | 73136 |
| III-(3m/s) | 3.7 | 473.752 | 46.192 | 417580 | 73136 |
CONCLUSIONS:
1. The simulation is mesh dependent, we get better resolution of temperature, HTC, Flux and the velocity vectors, where the recirculatory regions can be spotted.
2. With the pointers given above we can place the components, by avoiding hotspots i.e below the processor hind part. The circuit can be planned accordingly.
3. The HTC reduces with increase in velocity, because greater convective temperature differential is set-up.
4. Processor temp also decreases with increase in velocity of air, as more cooling can take place.
Hence CHT analysis complete on graphic card.