Week 6 - CHT Analysis on a Graphics card
Aim:
1.Perform a steady-state conjugate heat transfer analysis on a model of a graphics card. Use appropriate materials of your choice for the simulation. Make sure to properly define the correct solid and fluid zones.
2.Run the simulation for best possible mesh with combination of coarse and refined mesh in different regions. Explain the reason for choosing the particular mesh settings.
3.Run the simulation by varying the velocity from 1m/sec to 5m/sec for at least 3 velocities and discuss the results.
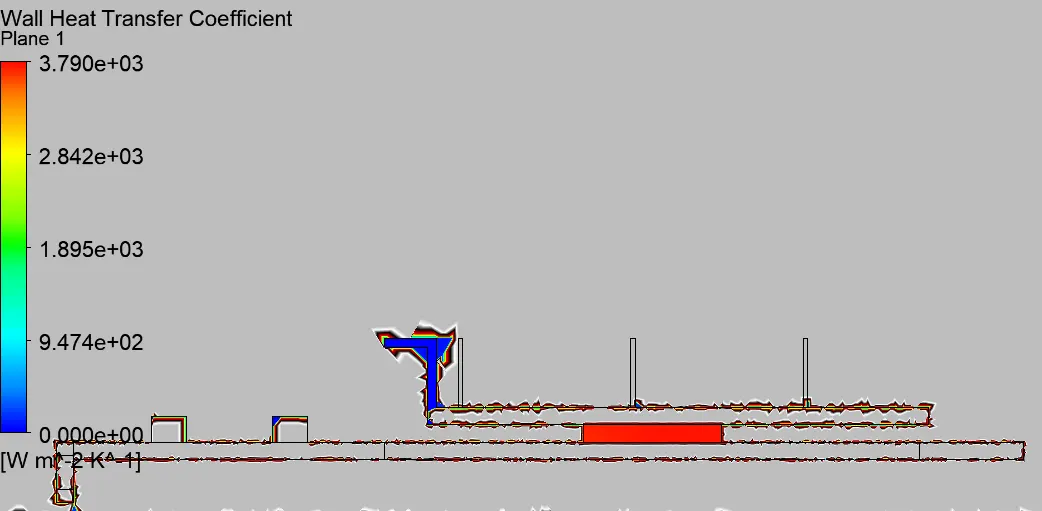
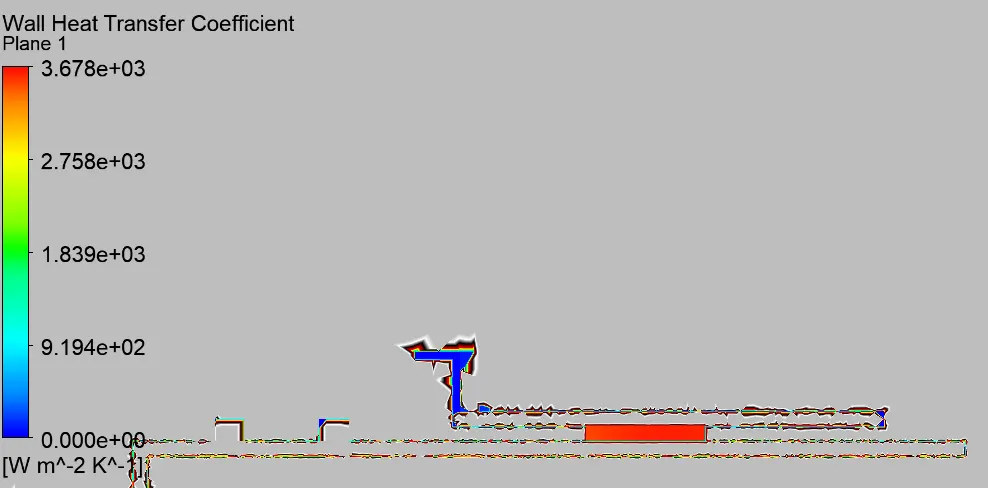
4.Find out the maximum temperature and heat transfer coefficient attained by the processor.
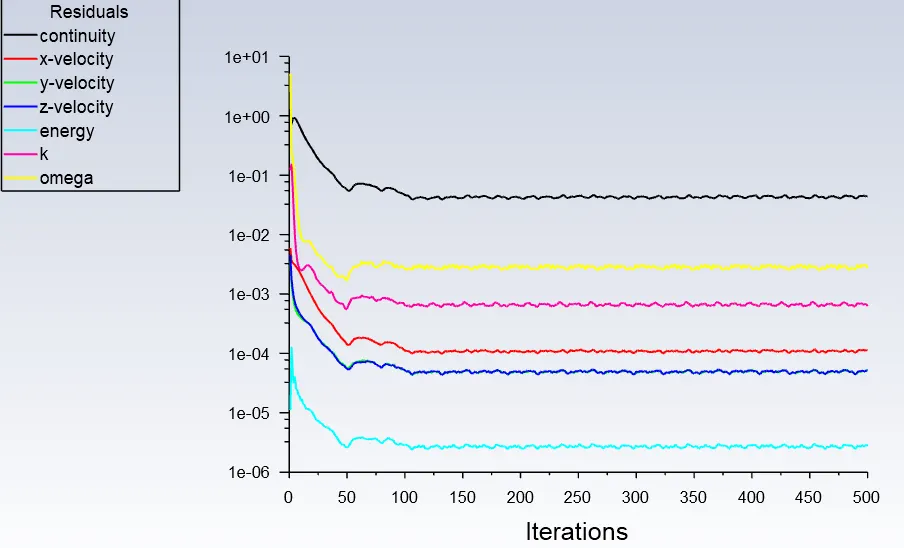
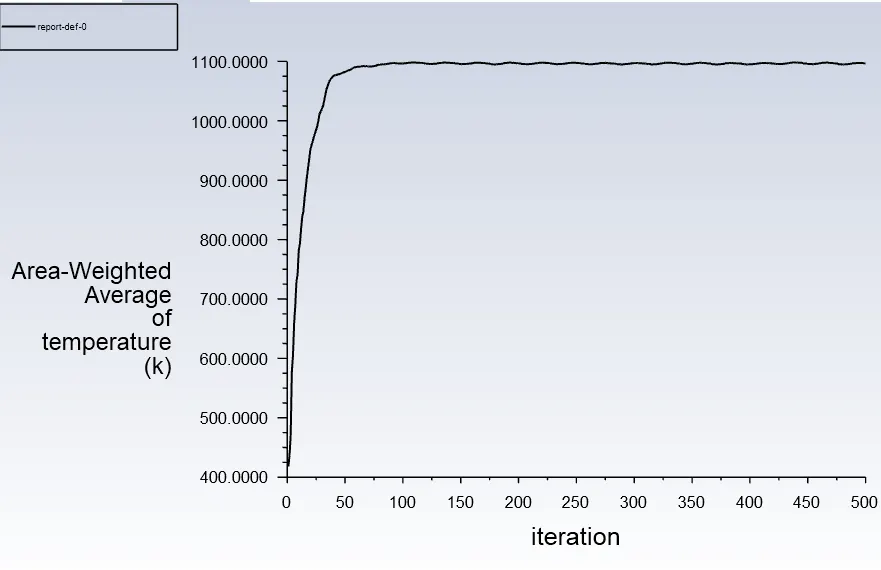
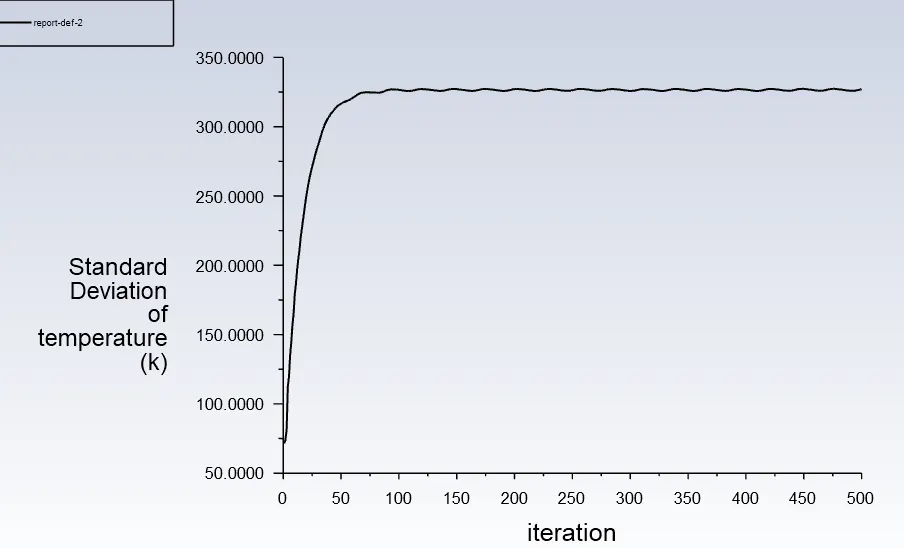
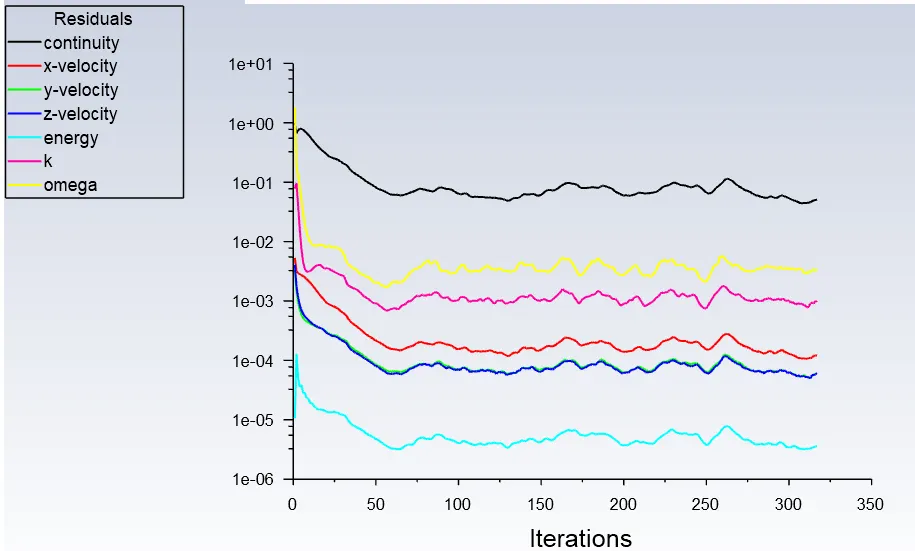
5.Prove that the simulation has achieved convergence with appropriate images and plots.
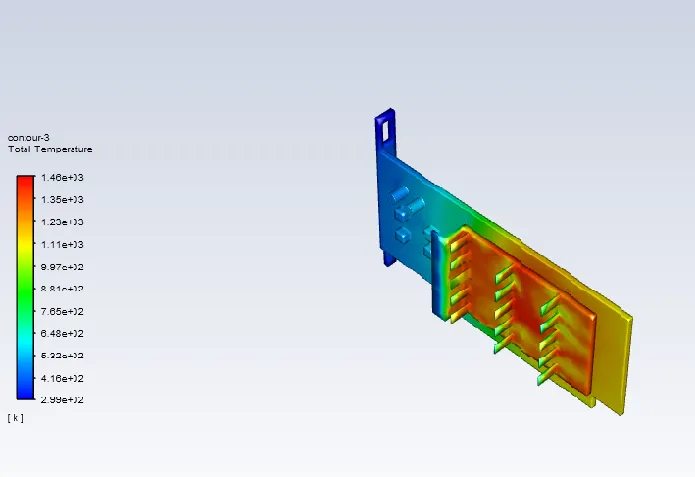
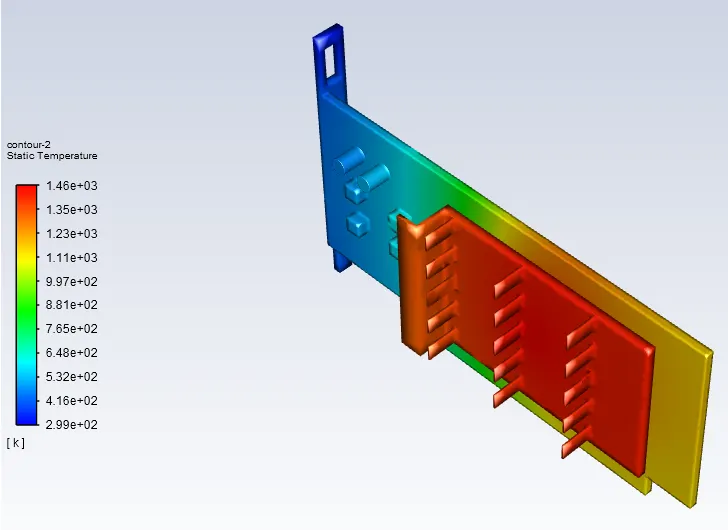
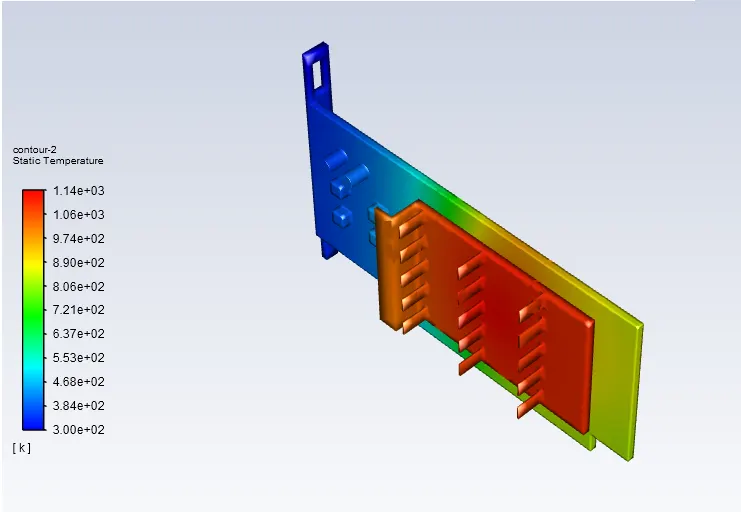
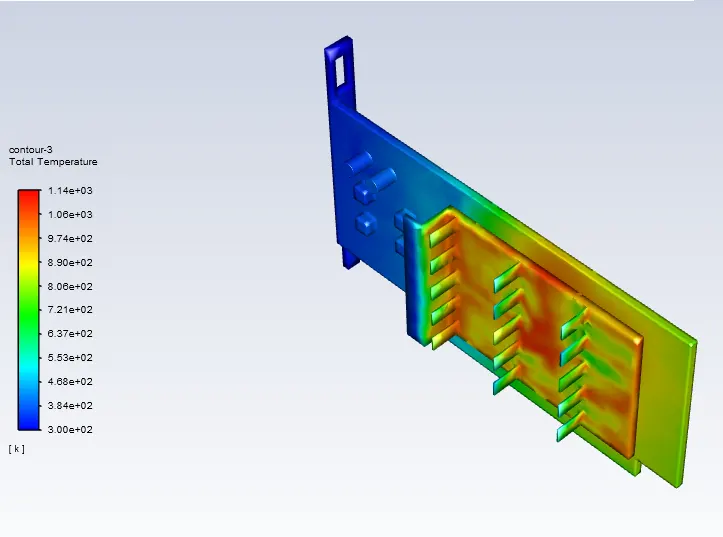
6.Identify potential hotspots on the model.
Solution :
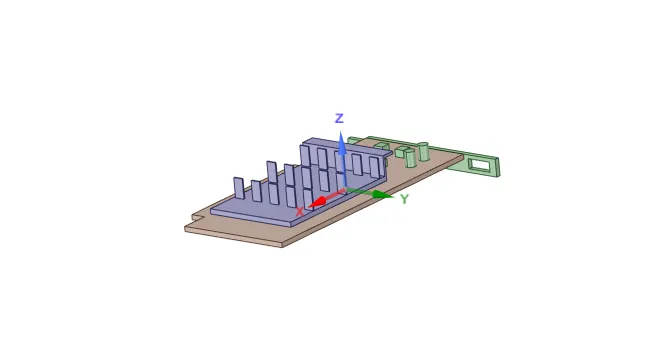
Graphic Card :
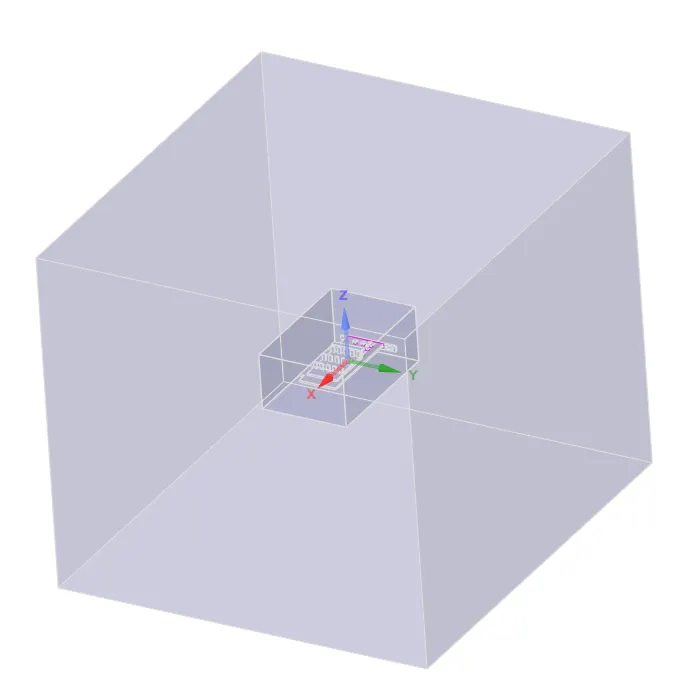
Now two enclosures are created so that a fine mesh is created in the inner enclosure and a coarse mesh is created in the outside enclosure.
Conjugate Heat Transfer Analysis
Conjugate Heat Transfer analysis provides the temperature distribution in solid and coolant of the engine and clear insight on velocity distribution and mechanism of heat transfer of coolant. Results of CHT analysis become input to structural simulations as thermal loads.The analysis type Conjugate heat transfer (CHT) allows for the simulation of heat transfer between Solid and Fluid domains by exchanging thermal energy at the interfaces between them.
CHT can be performed to improve cooling performance of the water jacket and increase engine life. Advancements in cooling for applications such as gas turbines components require improved understanding of the complex heat transfer mechanisms and the interactions between those mechanisms, which our engineers can perform without hassle. Critical cooling applications often rely on multiple thermal protection techniques, including internal cooling, external film cooling, etc
Turbulence Models for Heat Transfer :
The candidate models for evaluation are (1) the standard k – ε model, (2) the RNG k – ε model, (3) the realizable k – ε model, (4) the SST k – ω model, and (5) the LRR Reynolds stress transport model. Various near-wall treatments such as equilibrium wall function and two-layer enhanced wall treatment are used in combination with these turbulence models. The computations are performed using the commercial computational fluid dynamics (CFD) code Fluent.
Overall, the RNG k – ε model with the enhanced wall treatment and the SST k – ω model predict the Nusselt number distribution better than the other models for the flat plate as well as for the concave surface impingement cases. However, the hydrodynamic data such as the mean velocity profiles are not accurately predicted by the SST k – ω model for the concave surface impingement case, whereas the RNG k – ε model predictions of the velocity profiles agree very well with the experiment. The Reynolds stress model does not show any distinctive advantage over the other eddy viscosity models.
Nusselt Number
It is the ratio of convective to conductive heat transfer at a boundary in a fluid. Convection includes both advection(fluid motion) and diffusion (conduction). The conductive component is measured under the same conditions as the convective but for a hypothetically motionless fluid.
Shell Conduction :
The wall heat flux is given by :
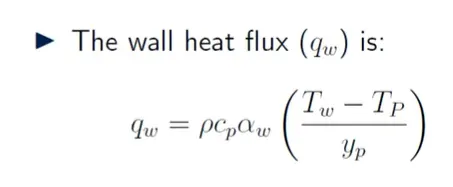
Now if the mesh size is very small ,the temperature variation normal to the wall surface ,hence no wall treatment is needed ,but if the mesh size is large than the temperature variation is not linear ,hence a wall treatment is needed for the alpha which has different values for visous sub layer and log law layer which is given by the following :

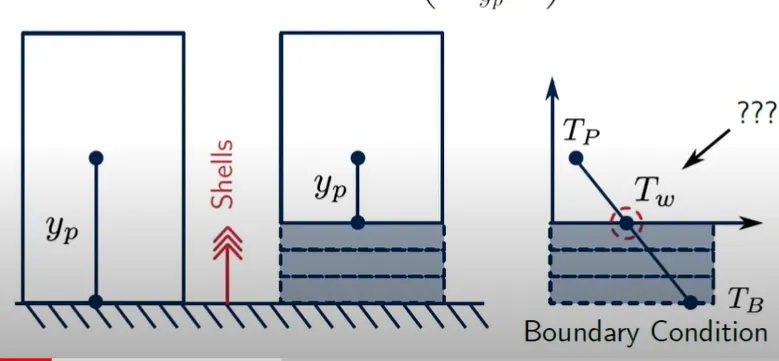
As you can see,the left most figure show a normal wall thickness applied while the right figures shows a shell conduction applied , yp is the wall distance of the first cell .After applying the shell conduction the distance reduces and hence the temperature variation tends to become more linear.
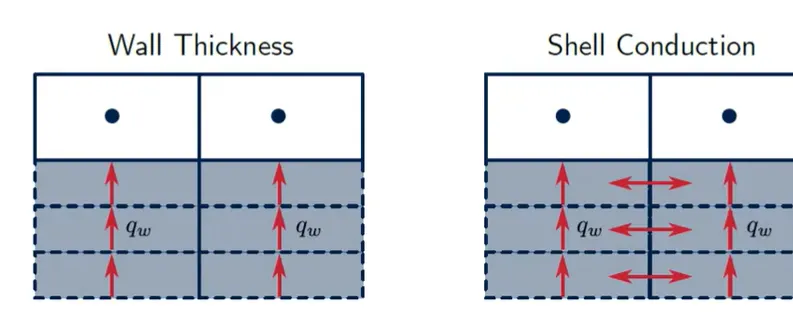
The heat flux is only in the normal direction for the wall thickness while for the shell thickness it is in the normal as well as in the parallel direction as shown above.Shell conduction smoothes the surface temperature distribution and re distributes the heat flux .
Case 1 : Outer Enclosure Mesh Size = 50 mm , Inner Enclosure Mesh Size = 10 mm , Graphic Card Mesh Size = 5 mm
Different Mesh sizes have been created as shown below :
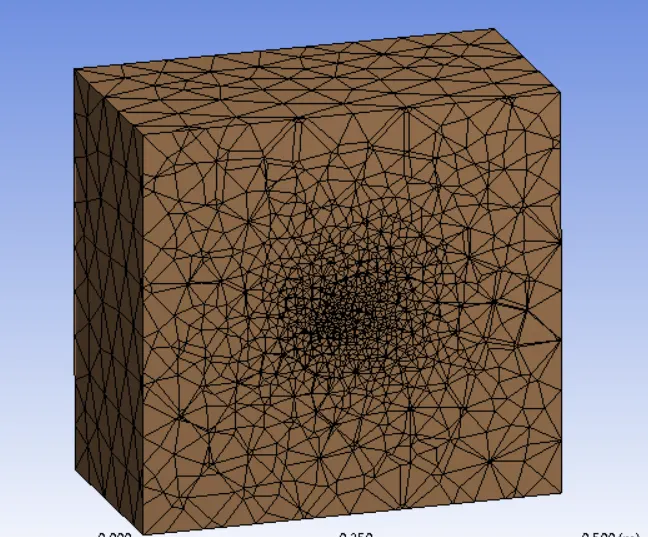
Outer Enclosure
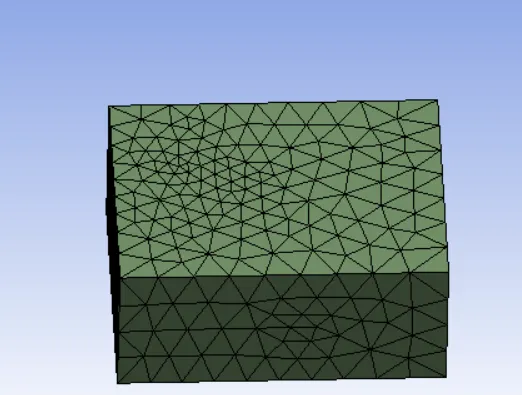
Graphic Card :
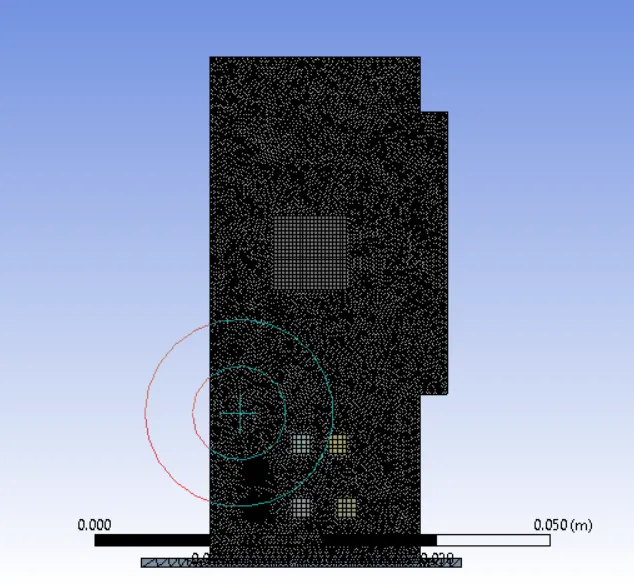
Now we will be applying a range of velocities at the inlet and analyse the heat transfer at the processor :
We will be using the energy equation as
is transfer of energy taking place in terms of heat and the turbulence model used will be k omega sst as it best decribes the boundary phenemonena .
Material Used in Graphic Card :
Circuit board- Holds all the components of the GPU
- Aluminum
- Copper- The main routes that carry electricity on the PCB
- Tin
- Zinc
- Gold/Silver- Interchangeable and used for connections and switches. Highly resistant to variable temperatures and heat, so it is used quite often to prevent breakage under stress. Gold is better but more expensive
- ABS or fiberglass- Layers the copper and is etched to make connections. Fiberglass is better but more expensive, and also less recyclable
GPU Chip- the thing that does all the work
- ~6 Billion Tantalum and Palladium transistors and capacitors
- Gold(switches)
- Silicon- Layered with tantalum to stabilize the chip and allow for better data storage with a smaller chip.
Other Circuit Board Components(Capacitors, etc.)
- Gold
- Nickel
- Platinum- Replaces nickel on higher-end GPUs
- Zinc
- Copper
- Ceramic
- Glass(Silica Compound
- Fluorite
- Epoxy Resin(Tree product)
- Steel
The following materials are assigned to the different materials as shown below :
1.Processor - Silicon
2.Circuit Board - Aluminium
3.Other Board Components - Steel
Heat Generation in Processor :
Graphics card temperatures typically range from 30°C to 40°C at idle and from 60°C to 85°C under load. Most high end video cards typically have a maximum temperature between 95°C-105°C, at which point the system will shut off to prevent damage. A video card is not considered to be overheating until it exceeds 90°c under load.
The heat given by the processor is given by : m*cp*T
Q= 0.05*0.71*378
= 13.41 W
Heat Generated / Volume = 134.1 w/m^3
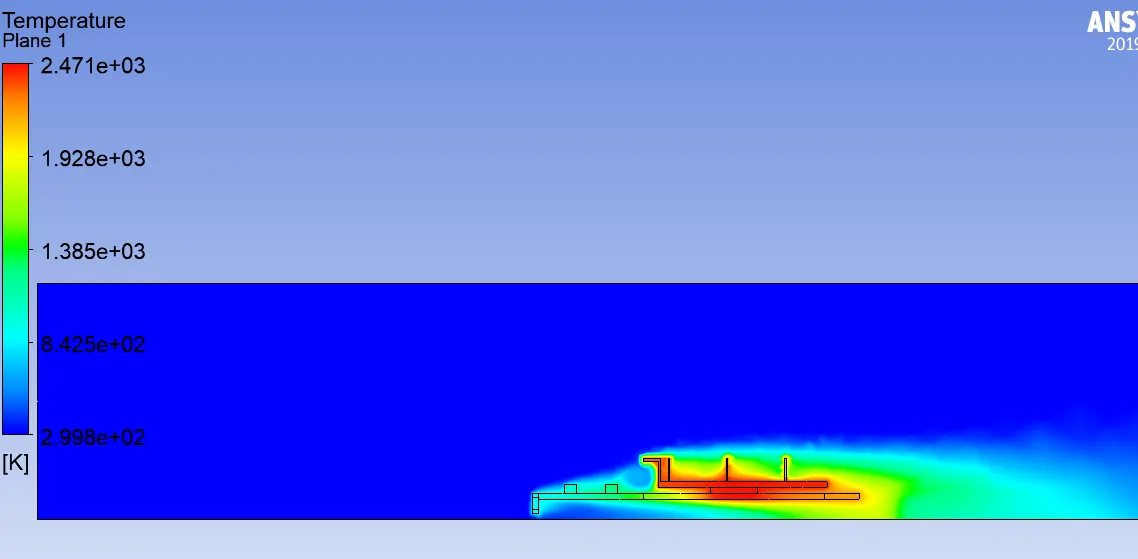
Case 1 : Inlet Velocity = 1 m/s
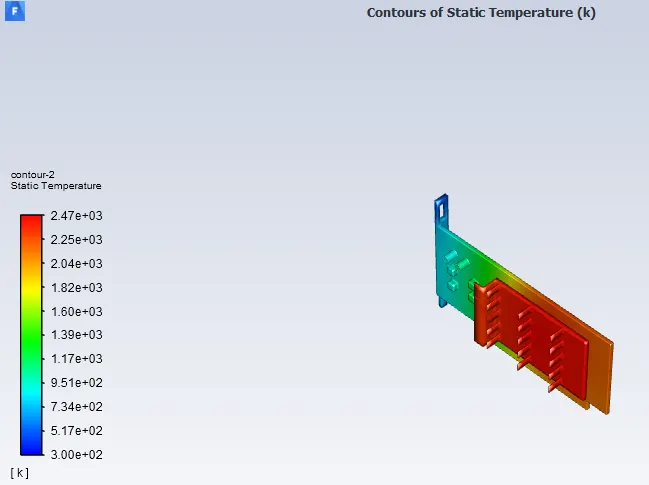
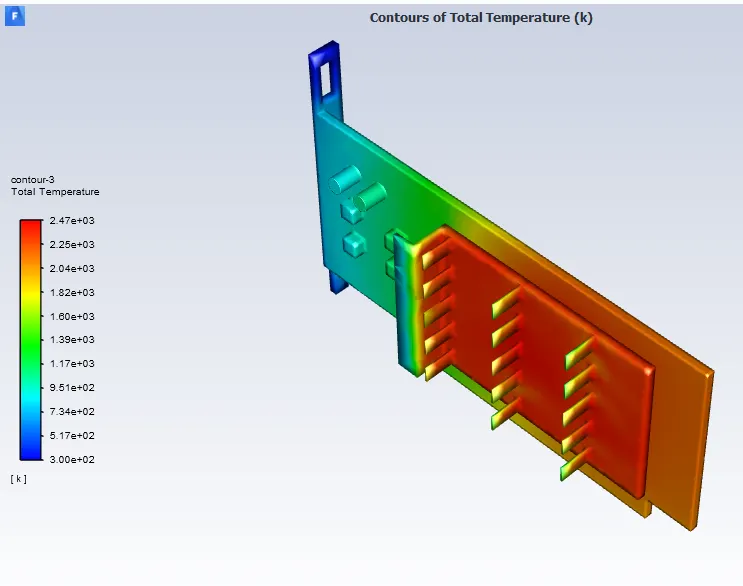
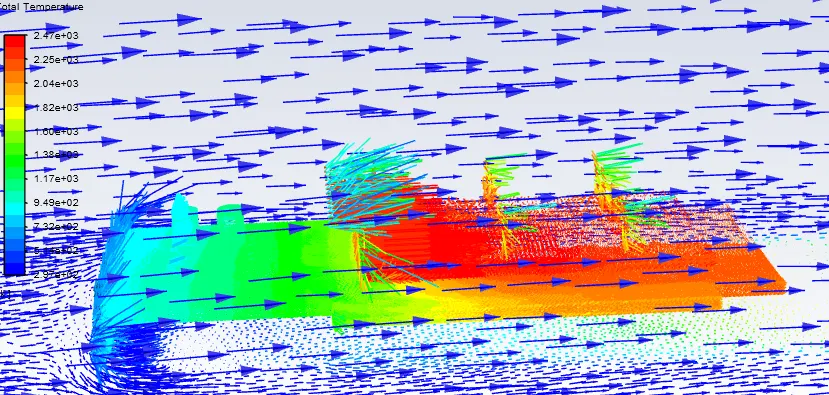
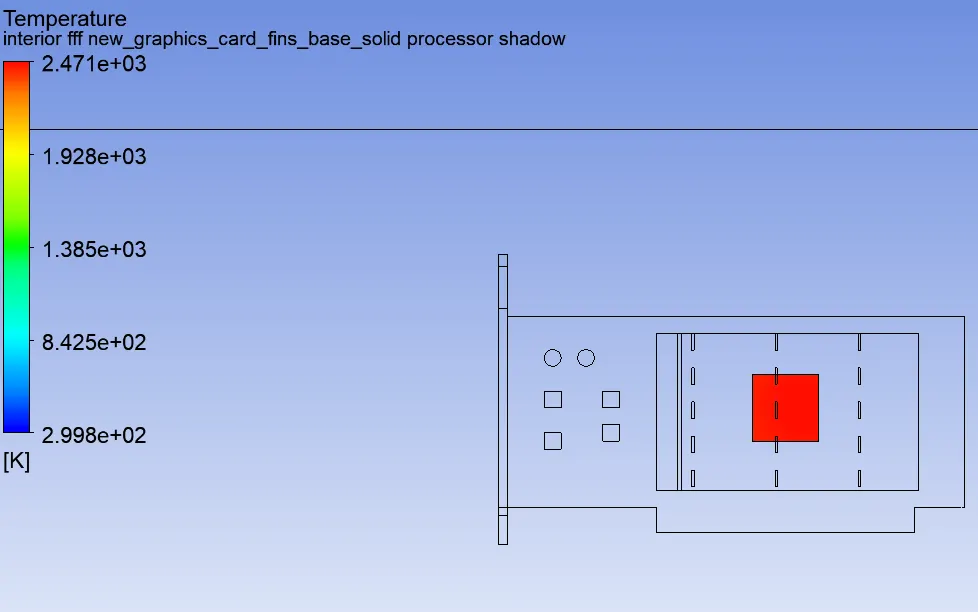
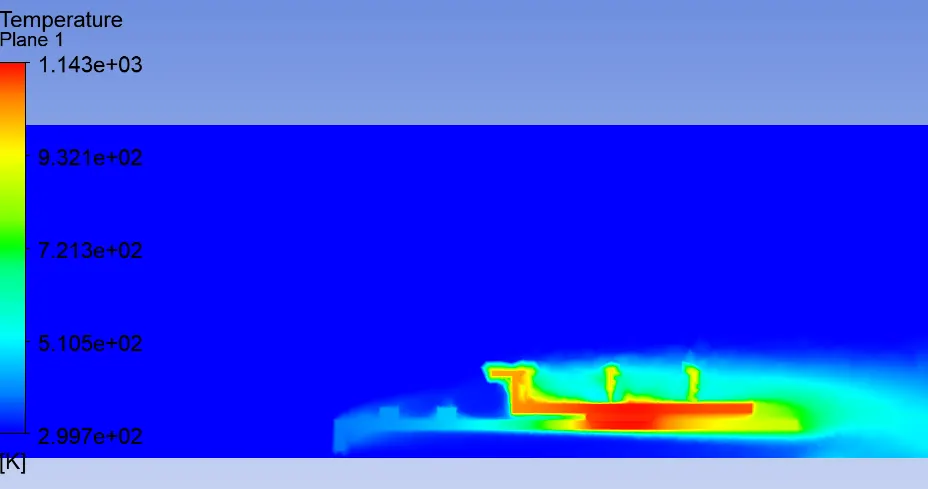
As you can see the hotspot of the graphic card is the processor which has the maximum temperature.
Case 2 : Inlet Velocity = 3 m/s ,Finer Mesh
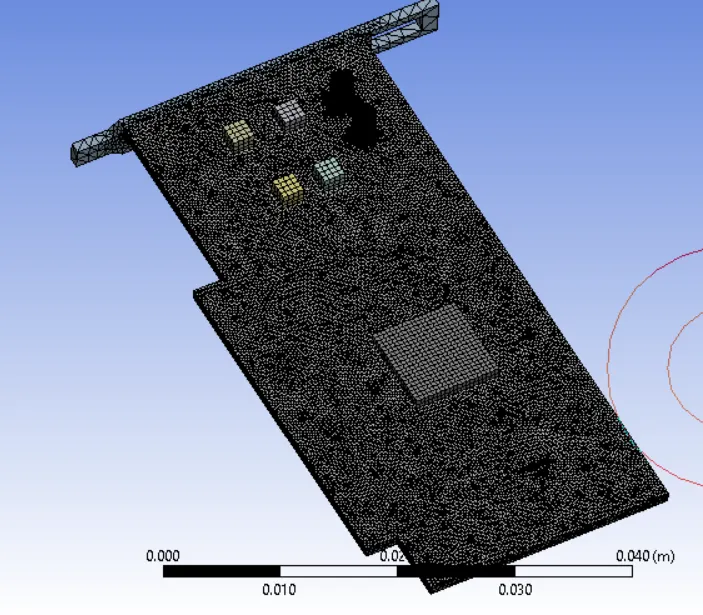
We will be reducing the mesh size as shown below :
The processor size has been reduced to 5 mm as shown below :
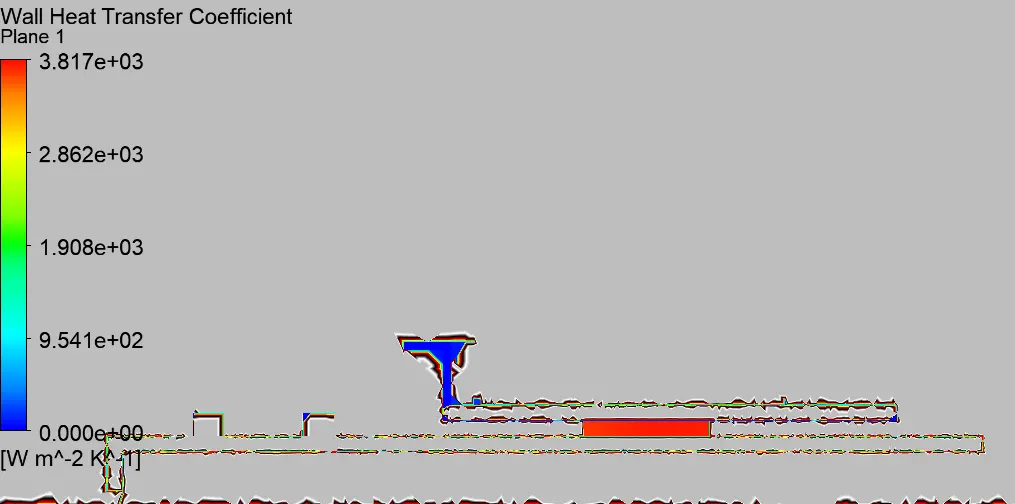
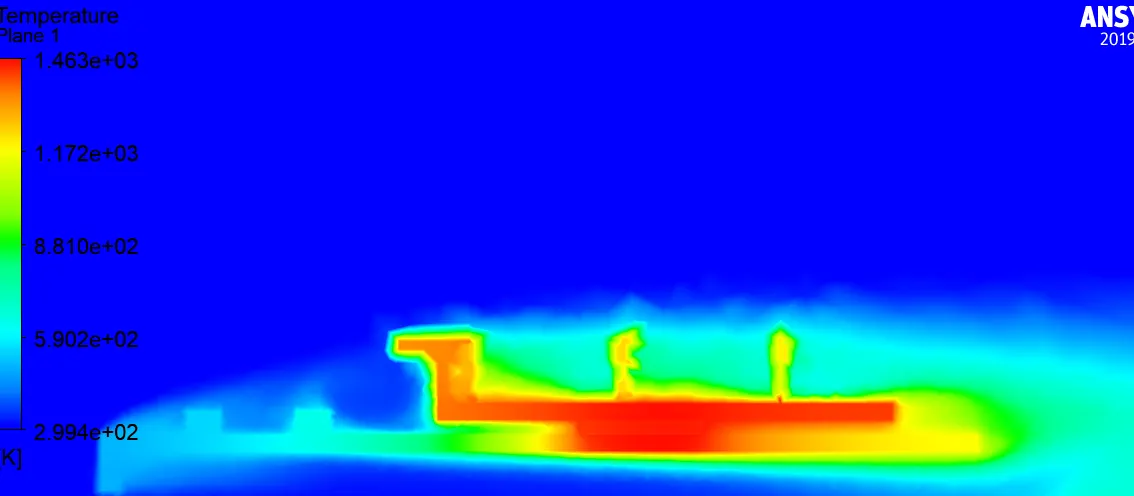
Case 3 : Inlet Velocity = 5 m/s ,Mesh Size = 0.5 mm
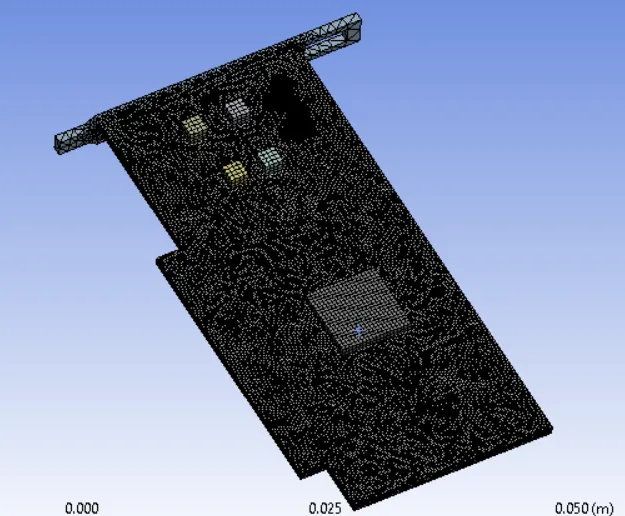
The mesh size has been reduced to 0.5 mm as shown below :
 \
\
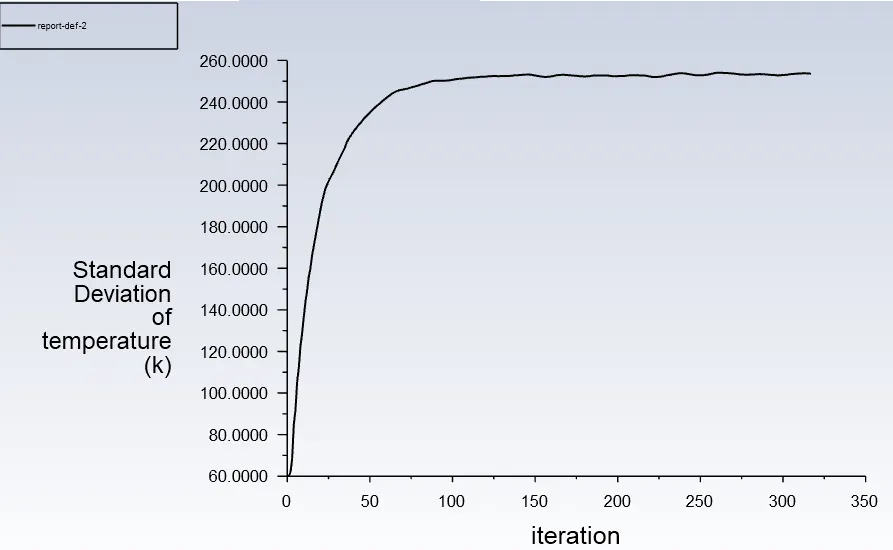
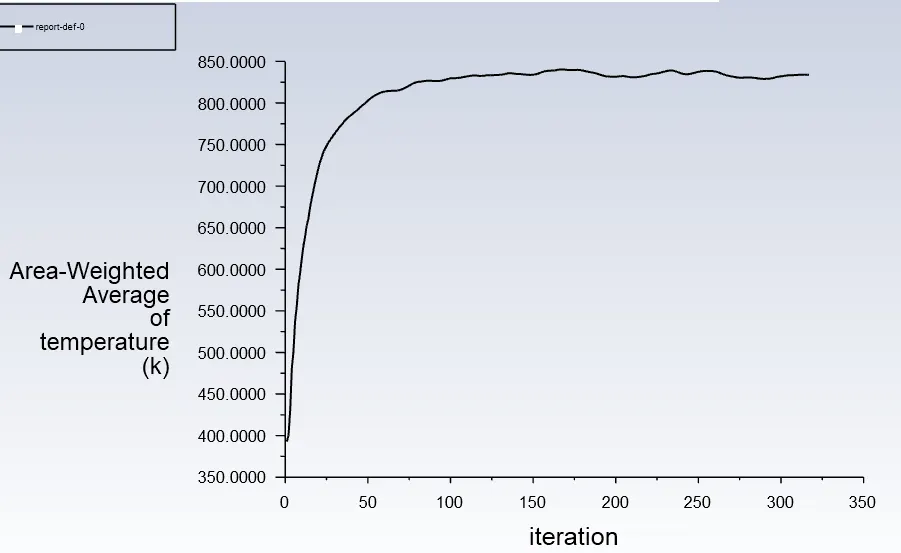
Conclusion
As the mesh size decreases ,the accuracy of heat dissiaption increases towards the atmosphere.
As the inlet velocity increases ,the energy dissiaption increases because of increased turbulence.
The hotspot of the graphic card is the processpor which has the maximum temperature