Week 6.2 - Setting up a model (Hanging Node)
Objective:
For given CAD Model generate multi level meshing and perform thermal simulation for the model with necessary assumptions.
Steps to be performed:
1.Unpack the model into icepak
2.Generate mesh with Multi level settings to reduce No of nodes and elements (Done in assignment 2 week 5)
3.Perform thermal simulation of model in natural convection mode
4.Plot the contours of residuals and temperatures
Meshing:
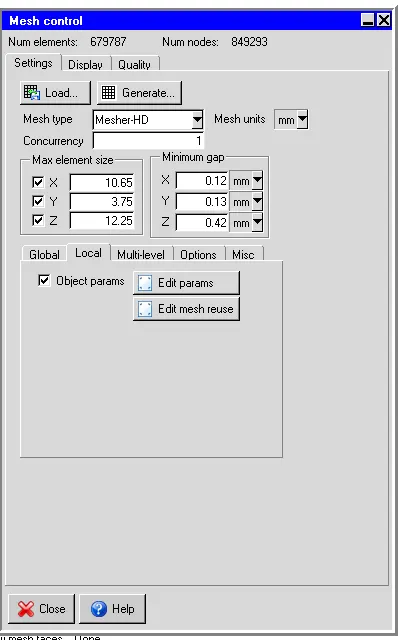
1. perform Multi level meshing and give slack values for sheet metal assay and for fan guide assembly
2.For sheetmetal assay slack values assigned=2,for fan guide assembly slack values assigned=1
3. After Multilevel meshing Num elements=679787 and Num of nodes=849293
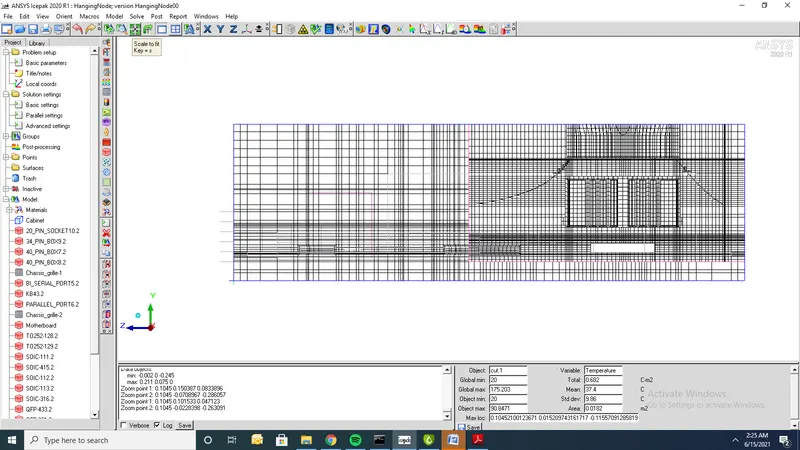
4. Cut plane mesh along x-axis
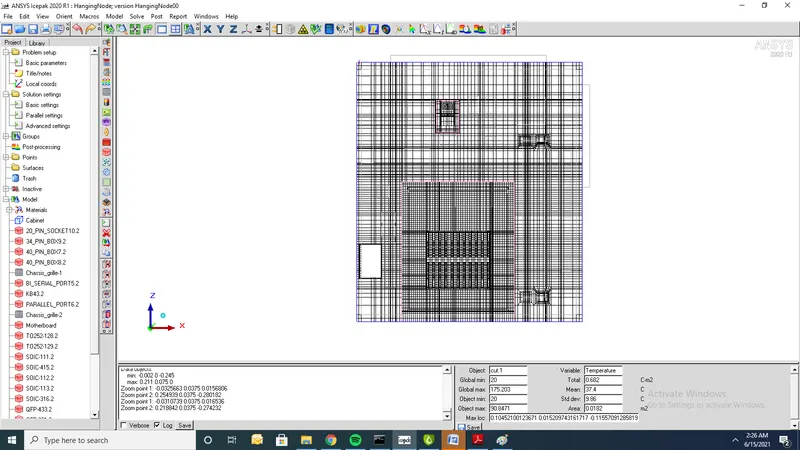
5.Cut plane mesh along y-axis
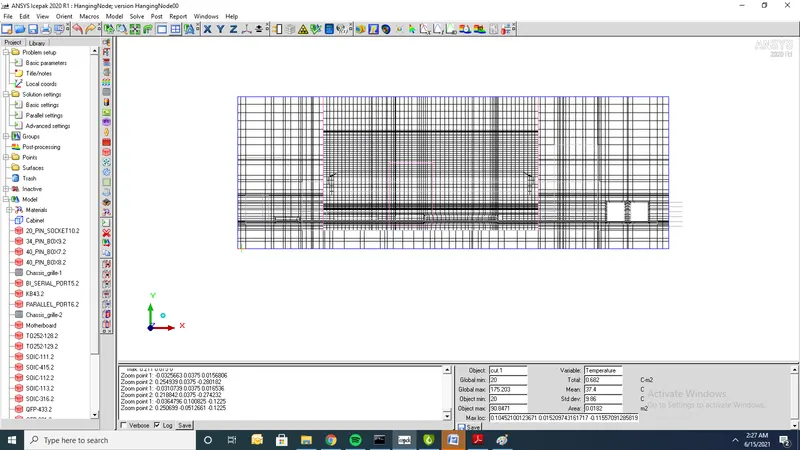
6.Cut plane mesh along z-axis
Source of Cad Model:
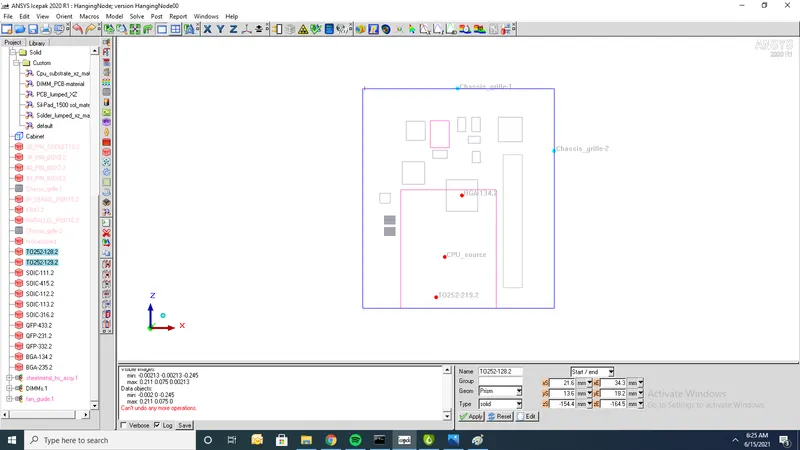
1.T0252-128.2(2 sources) which generates power of 0.2W as shown
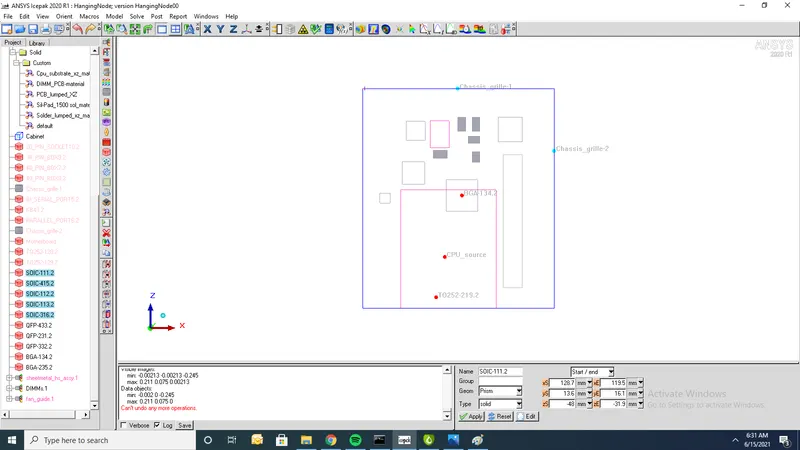
2. SOIC-(111.2,112.2,113.2,415.2,316.2) are diffrent sources which generate power of 0.3W are shown
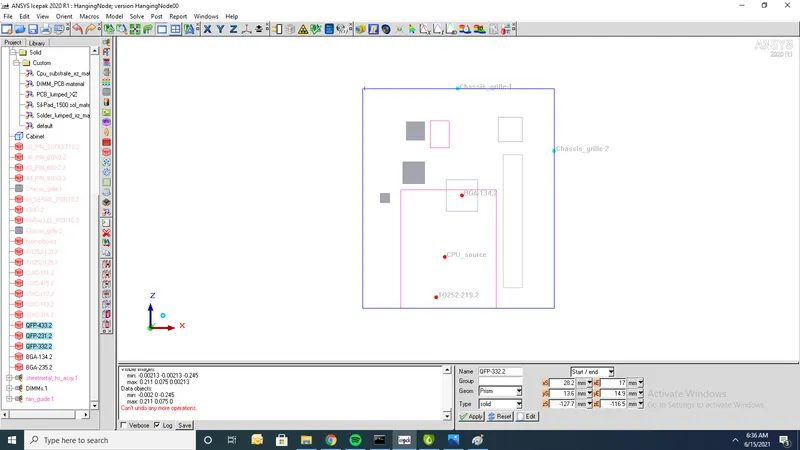
3.QFP-(433.2,231.2,332.2) are diffrent sources which generate power of 1.5W are shown
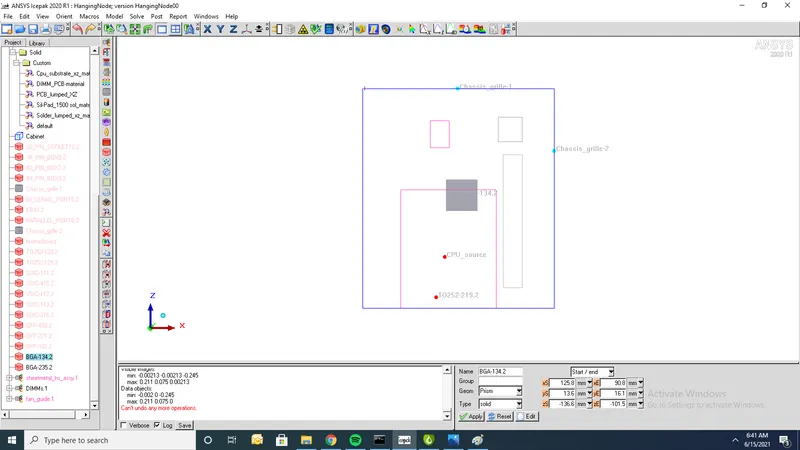
4.BGA-134.2 is source which generate power of 12W
5.BGA-235.2 is source which generate power of 6W
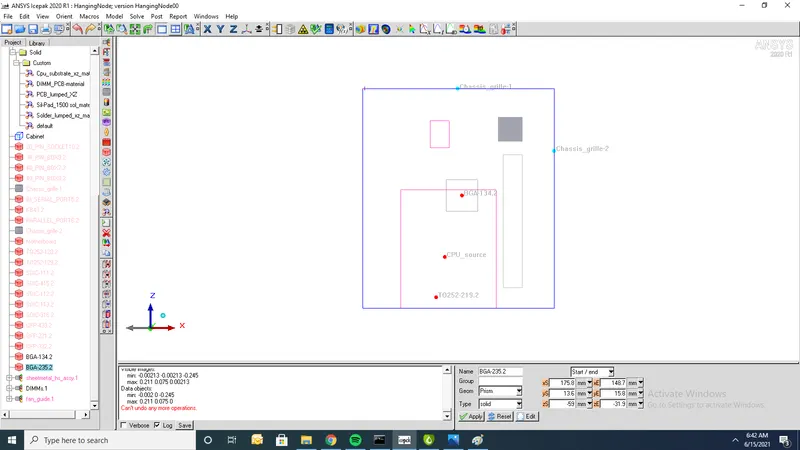
Table:
1. Table of different sources and their powers are shown and all together it generates power of 24.4W
| S.no | Source | Power(W) |
| 1 | BGA134.2 | 12 |
| 2 | BGA-235.2 | 06 |
| 3 | QFP-433.2 | 1.5 |
| 4 | QFP-231.2 | 1.5 |
| 5 | QFP-332.2 | 1.5 |
| 6 | SOIC111.2 |
0.3 |
| 7 | SOIC112.2 | 0.3 |
| 8 | SOIC113.2 | 0.3 |
| 9 | SOIC415.2 | 0.3 |
| 10 | SOIC316.2 | 0.3 |
| 11 | T0252.2 | 0.2 |
| 12 | T0128.2 | 0.2 |
.
Post-processing:
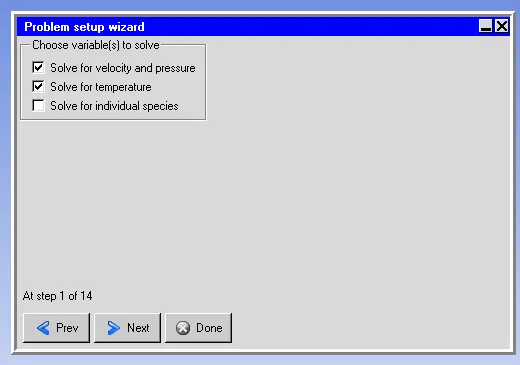
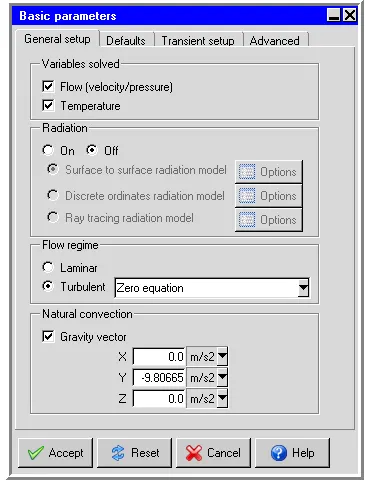
1.Choose variables for cad model
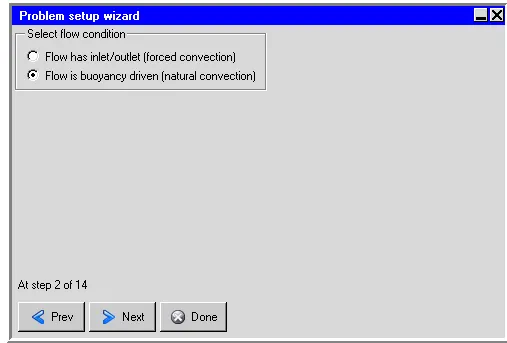
2. Flow is buoyancy driven
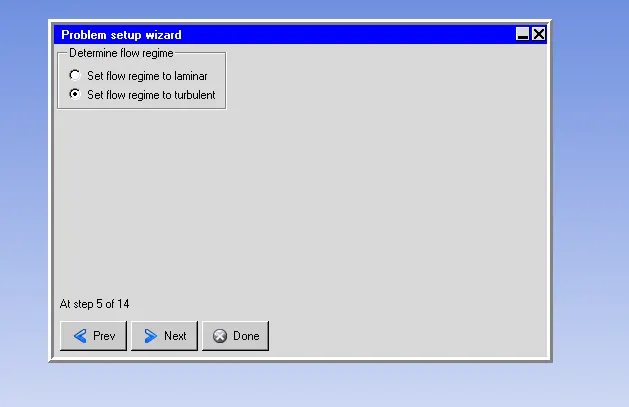
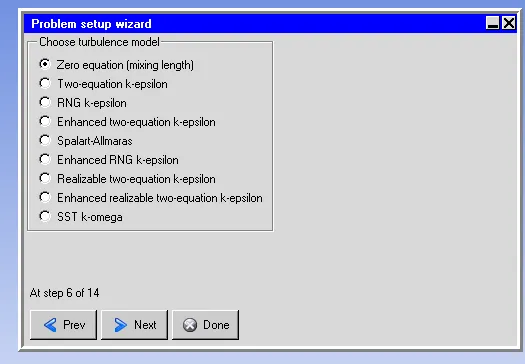
3.Set flow as turbulent
4.Zeo equation model
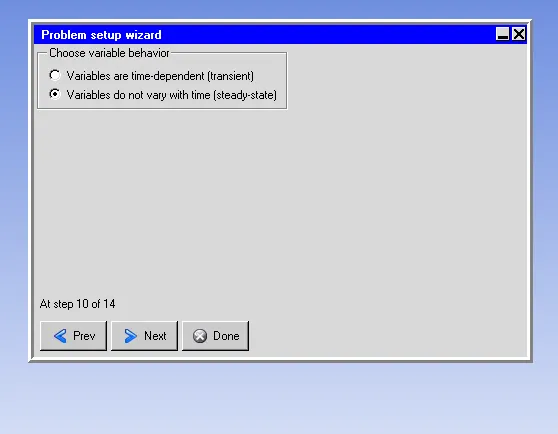
5.Steady state for given flow problem
Basic parameters:
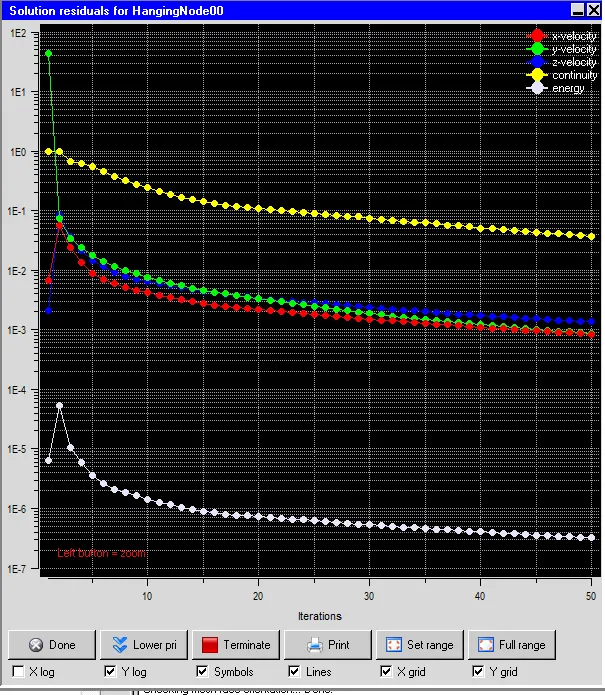
Residuals:
1.Solution residuals
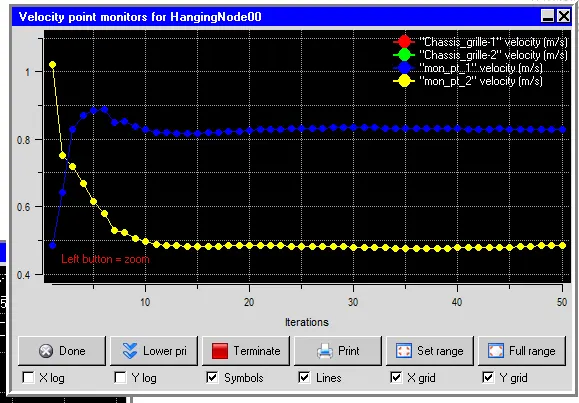
Monitor points:
1)Chassis grille-1 2)Chassis grille-2
Velocity contours
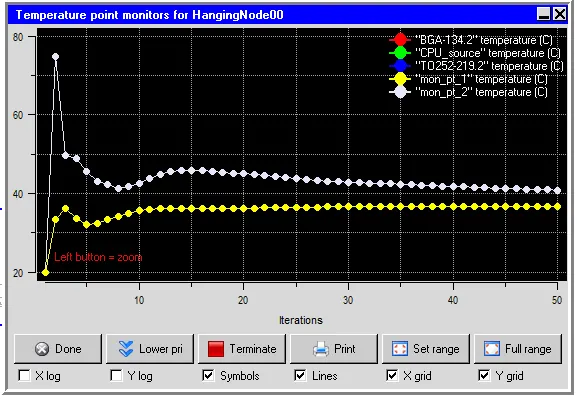
Temperature contours:
Contours:
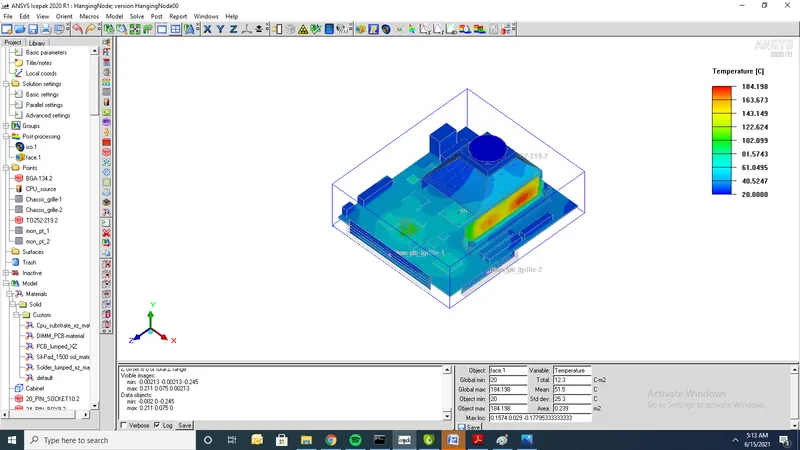
Temperature contours:
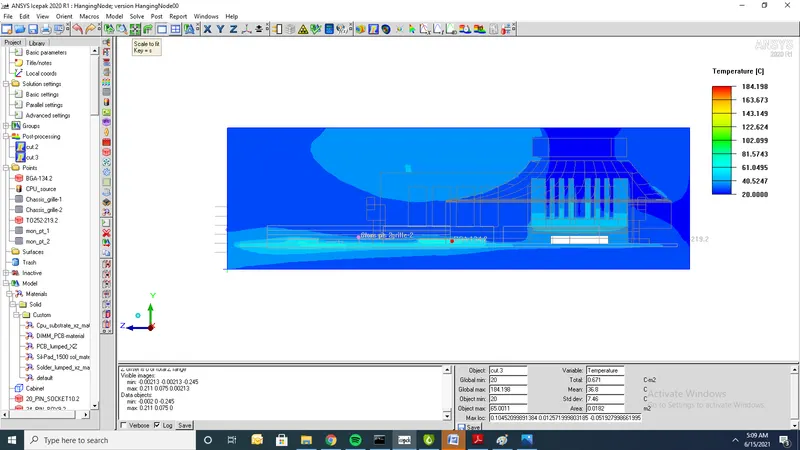
1)Temperature along x-axis
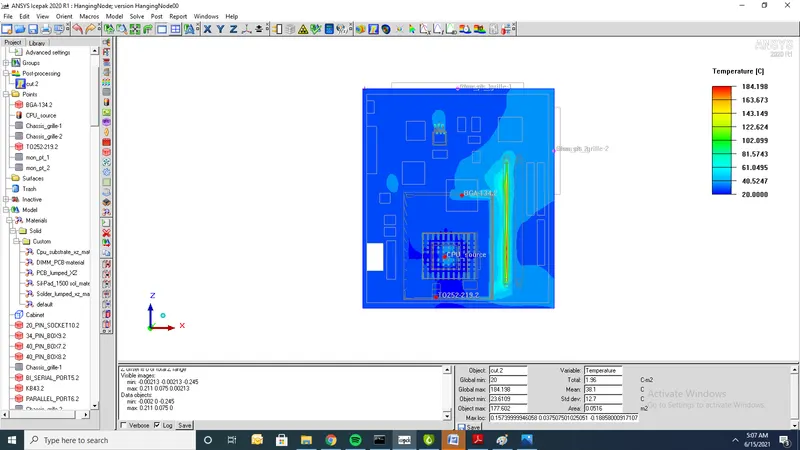
2)Temperature along y-axis
3)Temperature along z-axis
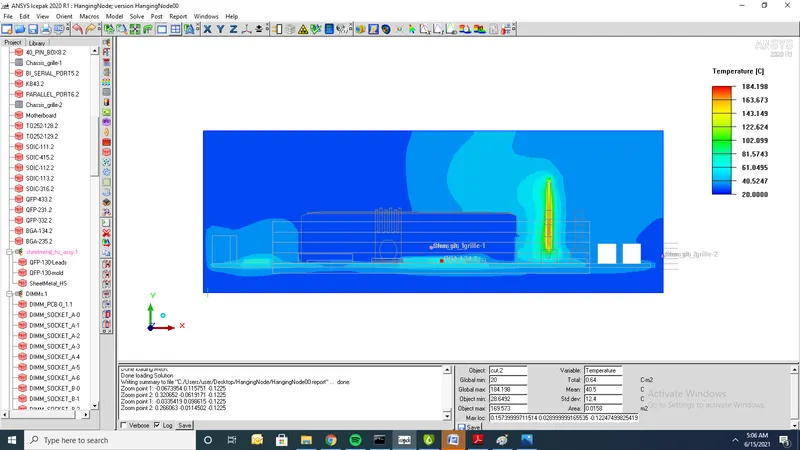
4)Object face temperature
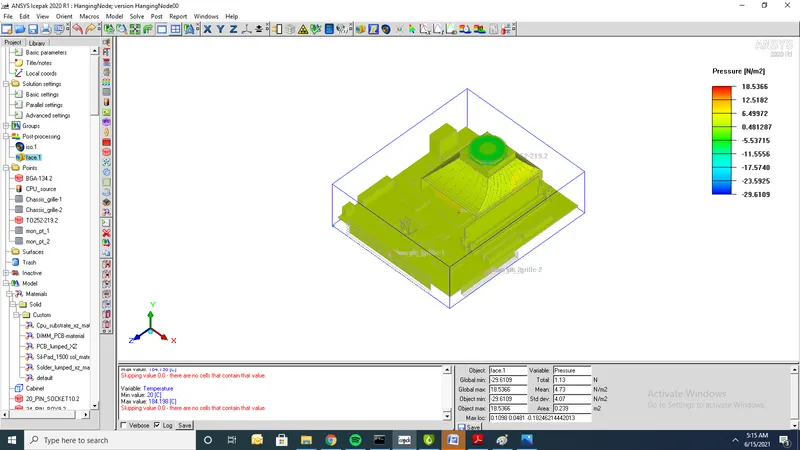
Pressure contours:
1)Object face pressure contours
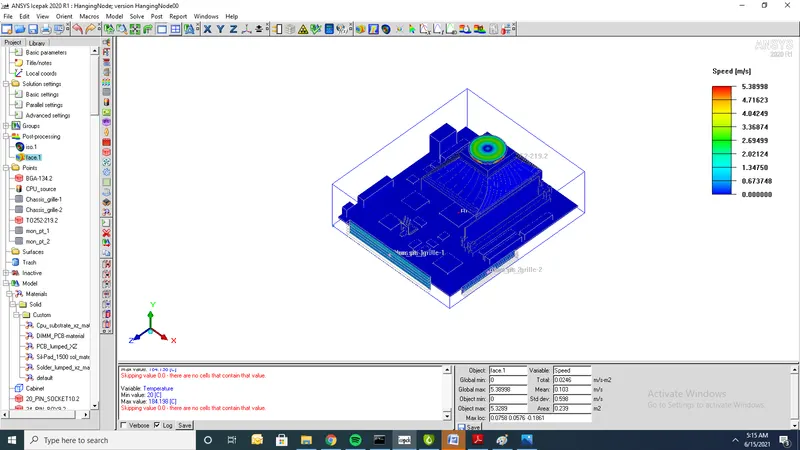
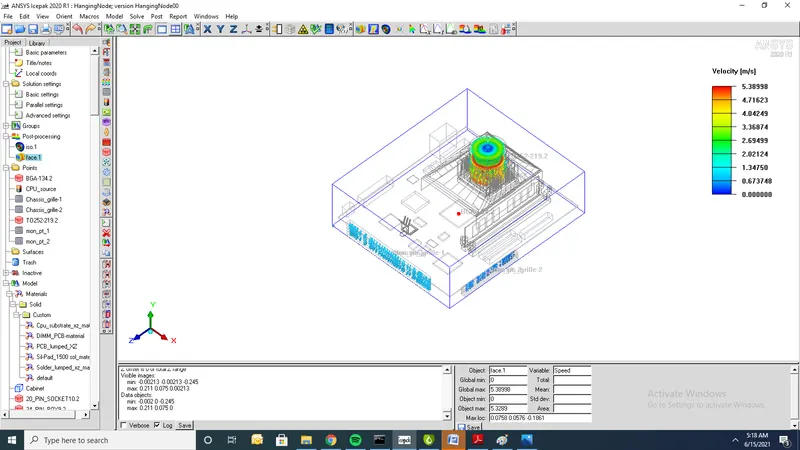
Speed contours:
1.Object face speed contours
Velocity Vectors:
Conclusion:
1.Residuals and monitor points graphs are plotted
2.Contours of temp,pressure,speed and velocity vectors are plotted
3.In given model under Natural convection max temp range=184.18 oC and min temperature=20 oC
4.In given model max preesure range =18.53 N/m^2 and min pressure =-23.61 N/m^2
5. In given model speed,velocity vectors having same values max speed range =5.3899 m/s and min speed = 0m/s
6. In natural convection heat transfer coeffcient is low compared to forced convection and it take more time to get cool or come to steady state