Week 5 Sphere pressing on a plate
Stress Concentration on Sphere Pressing on a Plate
OBJECTIVES:
To carry out a Static Structural Analysis of Sphere pressing on a plate for the given materials for the Plate and Sphere and determine the stress, deformation, and Plastic strain.
MATERIAL:
Static Structural Analysis was carried out with the given model. The material used for this analysis was STRUCTURAL STEEL NL and the analysis was carried out using ANSYS Mechanical Enterprise. The model for case-1 was imported to ANSYS Workbench software and is shown in the figure below.
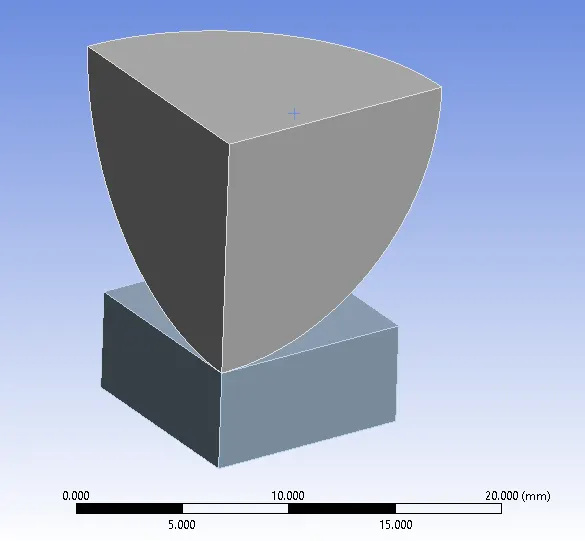
Fig.1 Sphere Pressing Setup
Later the material was assigned and the material and its properties used for this analysis are specified below. For Sphere, STRUCTURAL STEEL was used.
|
Material |
Structural Steel NL |
Structural Steel |
|
Density |
7.85e-6 kg/mm3 |
7.85e-6 kg/mm3 |
|
Young’s Modulus |
2e+5 MPa |
2e+5 MPa |
|
Thermal Conductivity |
0.0605 W/mm°C |
0.0605 W/mm°C |
|
Specific Heat |
4.34e+5 mJ/kg°C |
4.34e+5 mJ/kg°C |
|
Tensile Yield Strength |
250 MPa |
250 MPa |
|
US/TM |
1450 MPa |
460 MPa |
|
Components |
Plate |
Sphere |
SYMMETRY:
Since the given setup is symmetrical, Symmetry was provided to the given quarter model in the respective X and Z-axis respectively.
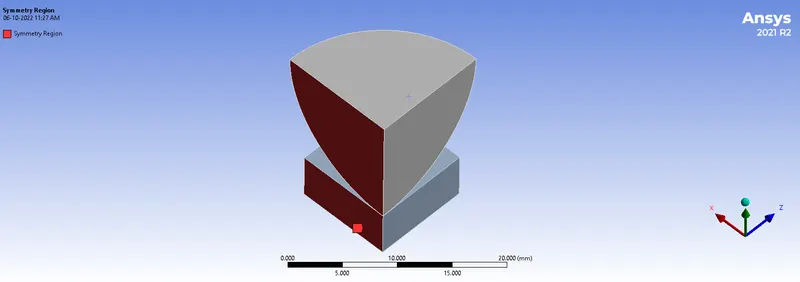
Fig.2 Symmetry of Z-axis
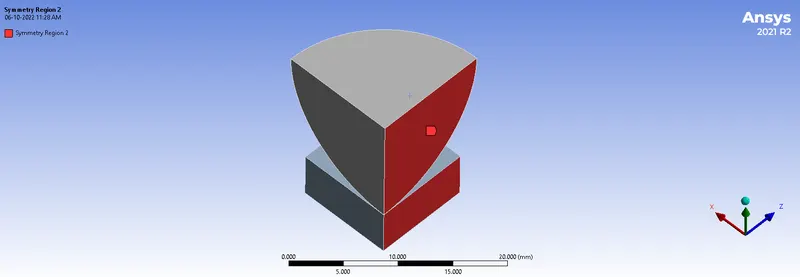
Fig.3 Symmetry of X-axis
MESHING:
Meshing is done by setting a method using Hexahedrons elements for Plate and Tetrahedron elements for Sphere then meshed with default mesh size.

Fig.4 Element Quality
A mesh metric that identifies elements according to their quality was employed and it can be seen that the elements of the lowest quality are minimal. Most of the elements have very high quality in the range of 0.9 to 1. Hence, the mesh is of acceptable quality. The meshed model is shown below.
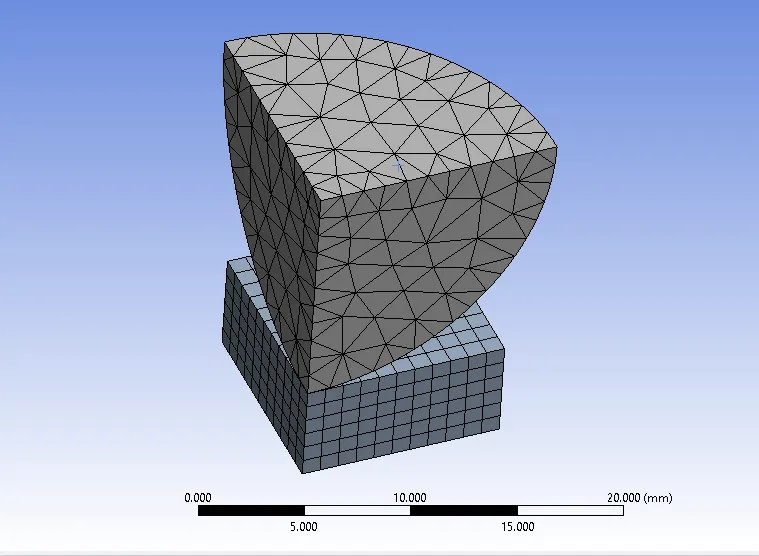
Fig.5 Meshed Model
CONTACT:
The contacts between the Sphere and the Plate are specified with a FRICTIONAL type connection. The contact is set: a) Plate (target), Sphere (contact) with the following data set.
- Friction value of 0.74
ANALYSIS SETTING:
4 STEPS ARE USED.
For all 4 steps:
- Auto Time Stepping: Program Controlled
- Solver Type: Direct
- Large deflection: ON
BOUNDARY CONDITIONS AND LOAD:
The DISPLACEMENT was provided to the Sphere to move in the negative Y direction for 4mm and then retract to its original position and Fixed Support to the plate so that it does not move while the sphere presses onto the plate.
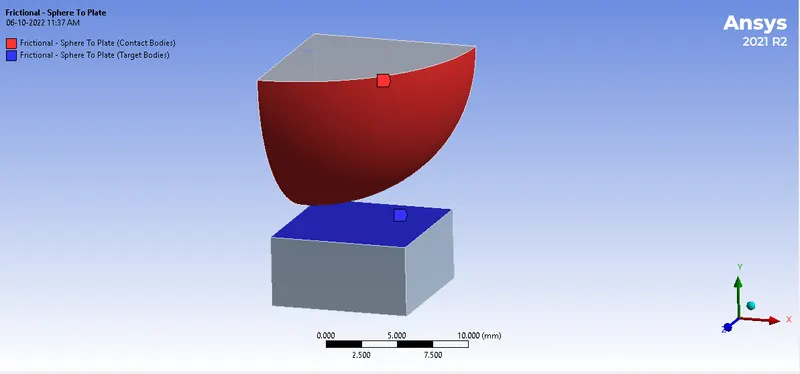
Fig.6 Frictional Contact
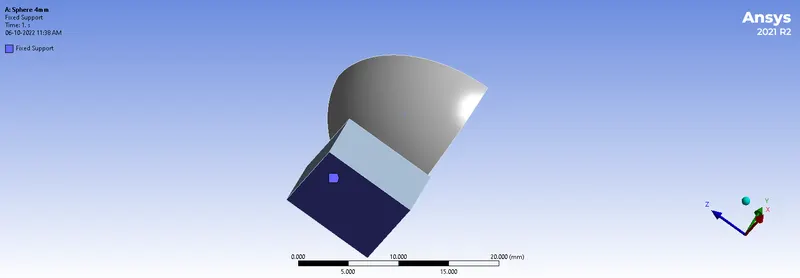
Fig.7 Fixed Support
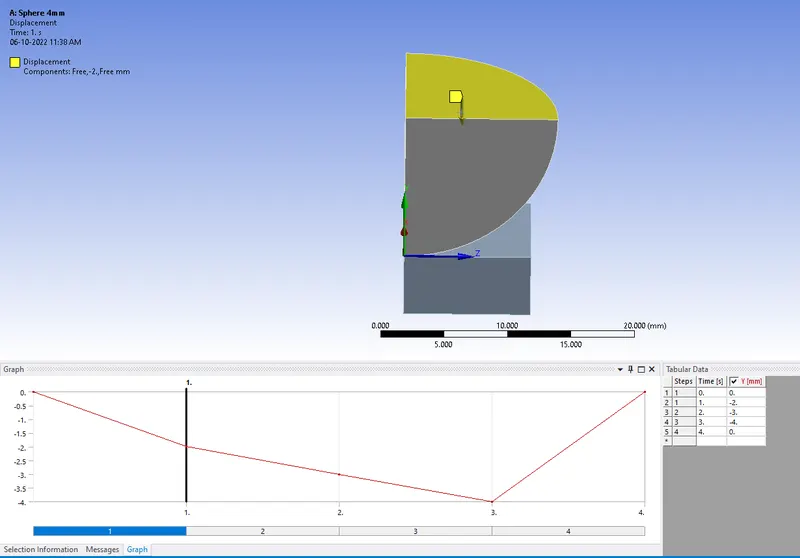
Fig.8 Displacement
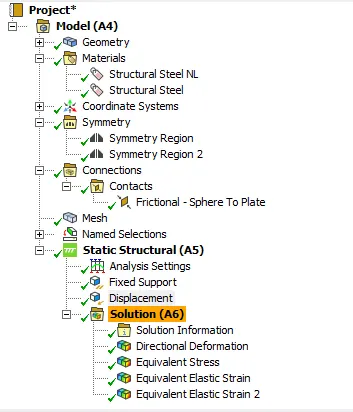
Fig.9 Case Setup
RESULTS:
The simulation was run and the results are tabulated below.
|
Output |
Maximum |
Minimum |
|
Equivalent Stress (Plate) [MPa] |
3310 |
35.425 |
|
Equivalent Plastic Strain (Sphere) [mm/mm] |
8.8986e-6 |
4.9964e-8 |
|
Equivalent Plastic Strain (Setup) [mm/mm] |
0.01654 |
4.9964e-8 |
|
Directional Deformation (Setup) Y-axis [mm] |
0.32938 |
-3.3802 |
The Directional Deformation of the Setup in the Y-axis obtained from the analysis is shown below.
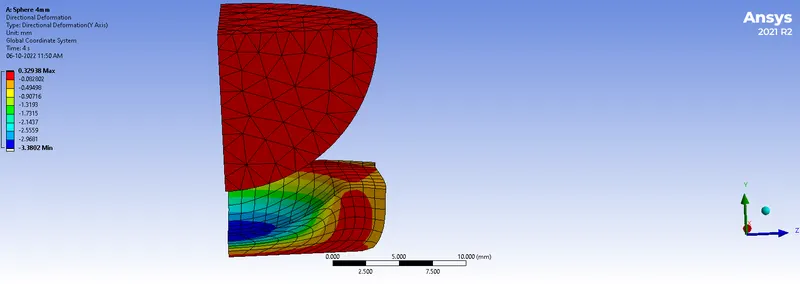
Fig.10 Directional Deformation in Y-axis Contour Plot
The Equivalent (Von-Mises) Stress of the Plate obtained from the analysis is shown below.
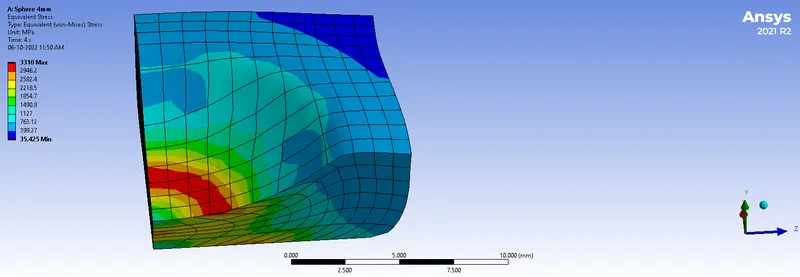
Fig.11 Equivalent Stress Contour Plot
The Equivalent Plastic Strain of the Sphere obtained from the analysis is shown below
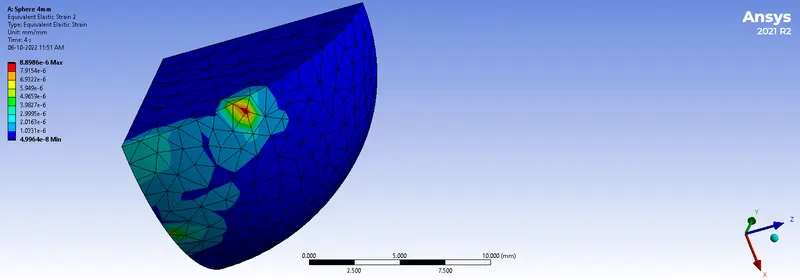
Fig.12 Equivalent Plastic Strain Contour Plot
The Equivalent Plastic Strain of the setup obtained from the analysis is shown below
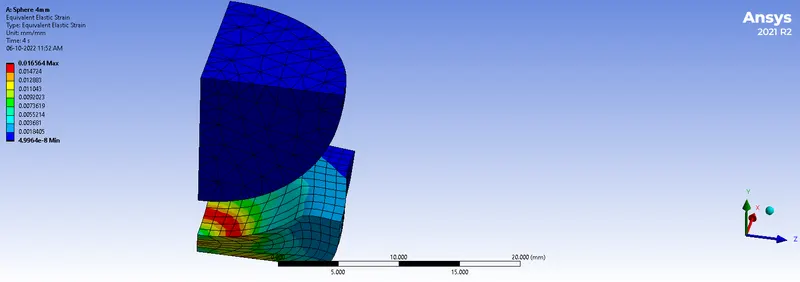
Fig. 13 Equivalent Plastic Strain Contour Plot
The Directional Deformation of the Setup in the Y-axis graph/table plot is shown below.
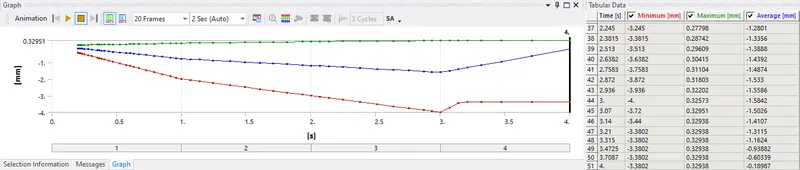
Fig.14 Directional Deformation in the Y-axis Table Plot
The Equivalent (Von-Mises) Stress of the Plate graph/table plot is shown below.
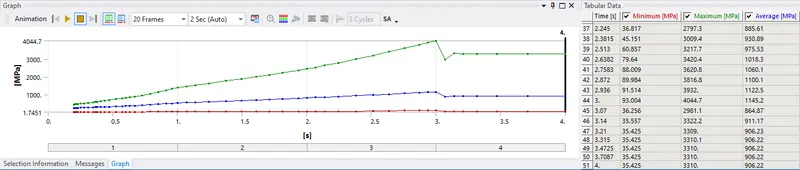
Fig.15 Equivalent Stress Table Plot
The Equivalent Elastic Strain of the Sphere graph plot is shown below
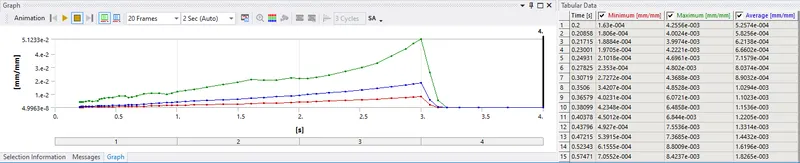
Fig.16 Equivalent Elastic Strain Table Plot
The Equivalent Elastic Strain of the Setup graph plot is shown below
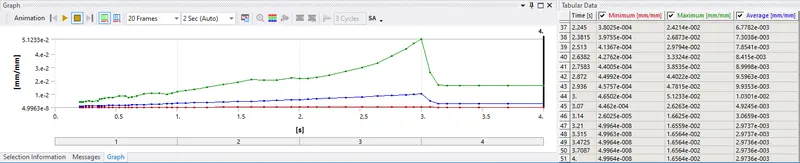
Fig. 17 Equivalent Elastic Strain Table Plot
CONCLUSION:
The analysis was run successfully and results were obtained and tabulated.
- The Maximum Stress of the Plate was 4044.7 MPa and
- The Maximum Plastic Strain of the Sphere and Setup was 5.1233e-2 mm/mm.
- The Maximum Directional Deformation in Y- the axis was 0.32938 mm.
- The plastic deformation was captured and shown in Figures 10 and 13.