Week 5 - Genetic Algorithm
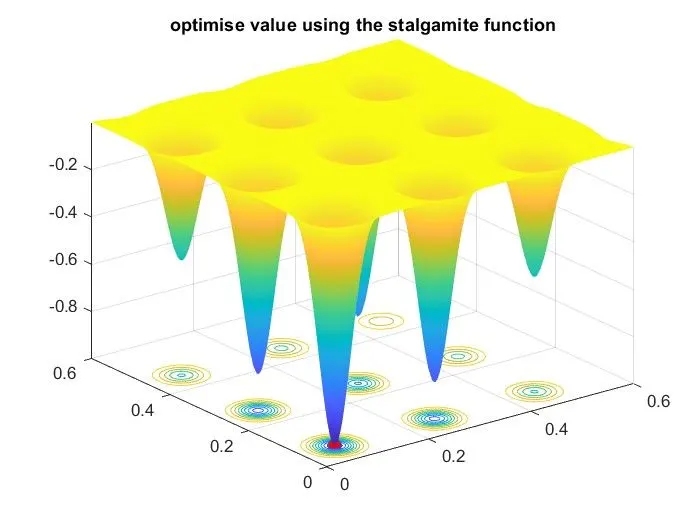
AIM: To obtain the stalgamite function and to find the global maxima of the function.
THEORY:Here mainly GA(genetic algorithym is used to find the values and the ga has a speciality that it always takes the random number of values and so that the the results obtained will be always different and this is the main challenge that will be faced in this programme .
`f(x,y) = f1,xf2,xf1,yf2,y`
`f1,x = [sin(5.1pix+0.5)]^6`
`f1,y = [sin(5.1piy+0.5)]^6`
`f2,x = exp[-4ln(2) (x-0.0667)^2/0.64]`
`f2,y = exp[-4ln(2) (y-0.0667)^2/0.64]`
function [f] = stalagmite(z) %function code

  x_1 = (sin((5.1*pi*z(1))+0.5))^6;
  y_1 = (sin((5.1*pi*z(2))+0.5))^6;

  a = ((z(1)-0.0667)^2/0.64);
  x_2 = exp(-4*log(2)*a);

  a_1 = ((z(2)-0.0667)^2/0.64);
  y_2 = exp(-4*log(2)*a_1);

  f = -(x_1*x_2*y_1*y_2);
end
this is the stalgamite function which is the main part of this programme in this intially we substitute the values in th genetic algorithym code but we would be oly getting different results in order to overcome this we uses this stalgaite function code in a rearranged manner and we get the values for the gertic alogrithym..
clear all
close all
clc

%defining our search space
x = linspace(0,0.6,150);
y = linspace(0,0.6,150);


%creating 2dimensional mesh
[xx yy] = meshgrid(x,y);

%number of itrtrationj
num_cases = 50;

%evaluating the stalagmite function
for i = 1:length(xx)
    for j = 1:length(yy)
        z(1) = xx(i,j);
        z(2) = yy(i,j);
        f(i,j) = stalagmite(z);
    end
end


%stastical behaviour (unbounded)
tic %for calculating the study time
for i = 1:num_cases
    [z,fopt(i)] = ga(@stalagmite,2);
    x_opt(i) = z(1);
    y_opt(i) = z(2);
end

study1_time = toc;

%plotting the graph
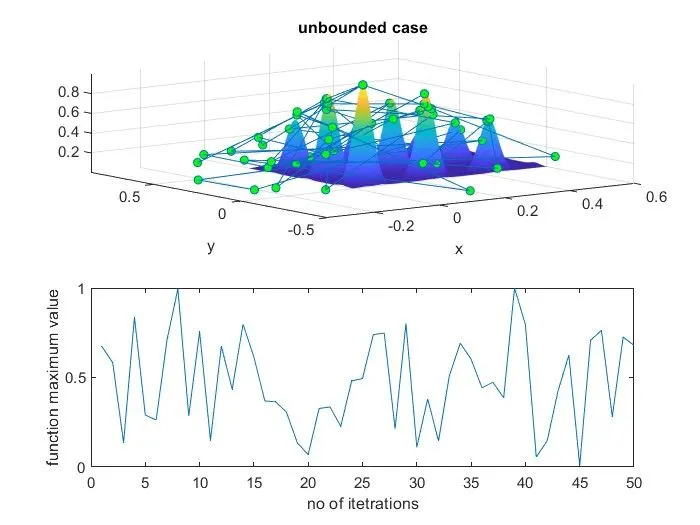
figure(2)
subplot(2,1,1)
surfc(xx,yy,-f)
hold on
shading interp
plot3(x_opt,y_opt,-fopt,'Marker','o','MarkerSize',5,'MarkerFaceColor','g');
title('unbounded case')
xlabel('x')
ylabel('y')
grid on
subplot(2,1,2)
plot(-fopt)
xlabel('no of itetrations')
ylabel('function maximum value')
%
%stastical behaviour (bounded)
tic
for j = 1:num_cases
    [z,fopt(j)] = ga(@stalagmite,2,[],[],[],[],[0;0],[1;1]);
    x_opt(j)=z(1);
    y_opt(j)=z(2);
end
study2_time=toc;
%plotting
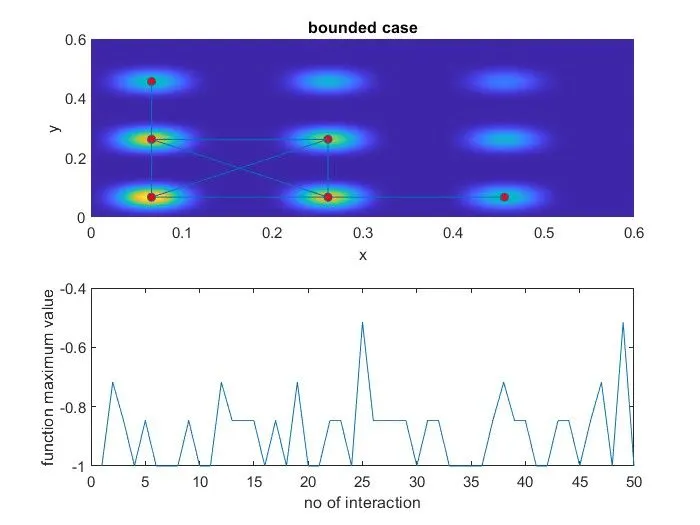
figure(3)
subplot(2,1,1);
hold on
surfc(xx,yy,-f)
shading interp
plot3(x_opt,y_opt,-fopt,'marker','o','MarkerSize',5,'MarkerFaceColor','r')
title('bounded case')
xlabel('x')
ylabel('y')
subplot(2,1,2);
plot(fopt)
xlabel('no of interaction')
ylabel('function maximum value')
%find the global maxima using stalagmite function
options = optimoptions('ga')
options = optimoptions(options,'populationsize',350);

for i =1:num_cases
[input,fval(i)] = ga(@stalagmite,2,[],[],[],[],[0;0],[1;1],[],[],options);
x_opt(i) = input(1);
y_opt(i)= input(2);

end


figure(1)
surfc(xx,yy,f)
shading interp
hold on
plot3(x_opt,y_opt,fval,'Marker','o','MarkerSize',8,'MarkerFacecolor' , 'r')
title('optimise value using the stalgamite function')
%surfc(xx,yy,f)
%surfc(xx,yy,-f)
%shading interp


%modyfying number of population
options = optimoptions('ga','populationsize',300);

tic
for k = 1:num_cases
    [z,fopt(k)] = ga(@stalgamite,2,[],[],[],[],[0;0],[1;1],[],[],options);
    x_opt(k) = z(1);
    y_opt(k)=z(2);
end
study_3time = toc;

%plotting
figure(4)
subplot(2,1,1)
hold on
surfc(xx,yy,-f)
shading interp
plot3(x_opt,y_opt,-fopt,'marker','o','MarkerSize',5,'MarkerFaceColor','r')
title('modifying the no of population')
xlabel('x')
ylabel('y')
grid on
subplot(2,1,2)
plot(-fopt);
xlabel('no of itetrations')
ylabel('function maximum value')
this is the main programme intially we start with close all ,clear all ,clc so that we would be able to remove all the results and codes intially we define the search space by giving the command linspace which would be written over the format of x values and y values and which has a interval and we get 150 values between the x and y at a constant difference.here in this programme we use the number of itetrations as 50 .for the evaluation of the function we run in a foor loop i eqals the length of xx and j equals the lengtth of yy and with this we find the values of z(1 )and z(2) and we could run the code safely then we find the stalgatime function for z and we end the both the loops.
first condition the unbounded condition
here we uses the tic and toc command and in this the tic function records the current time and the toc function uses the recirded values to calculate the elasped value timerval = tic store the current time in interval so that you can passs it explictly to the toc function then ewe give the plot for the graph and also we the surface plot and subplot x y and the f optimum value sand after running these codes we be using the hold on command so that the command stops accordingly and wait for the other inputs and after the other inpuyts only the code runs and now we the shading interp command in this command we revove the gridlines over the graph so that we could graph properly.then we plot for with the parameters of x optimum y optimum marker o and the size of marker about 5 and the markercolor of green and we dife the objects in the graph and then we give the tittle to the plot and we mark the x and y label accordingly and then we on the grid .
second condition
here we uses the tic and toc command and in this the tic function records the current time and the toc function uses the recirded values to calculate the elasped value timerval = tic store the current time in interval so that you can passs it explictly to the toc function then ewe give the plot for the graph and also we the surface plot and subplot x y and the f optimum value sand after running these codes we be using the hold on command so that the command stops accordingly and wait for the other inputs and after the other inpuyts only the code runs and now we the shading interp command in this command we revove the gridlines over the graph so that we could graph properly.then we plot for with the parameters of x optimum y optimum marker o and the size of marker about 5 and the markercolor of green and we dife the objects in the graph and then we give the tittle to the plot and we mark the x and y label accordingly and then we on the grid .
third condition
here we uses the tic and toc command and in this the tic function records the current time and the toc function uses the recirded values to calculate the elasped value timerval = tic store the current time in interval so that you can passs it explictly to the toc function then ewe give the plot for the graph and also we the surface plot and subplot x y and the f optimum value sand after running these codes we be using the hold on command so that the command stops accordingly and wait for the other inputs and after the other inpuyts only the code runs and now we the shading interp command in this command we revove the gridlines over the graph so that we could graph properly.then we plot for with the parameters of x optimum y optimum marker o and the size of marker about 5 and the markercolor of green and we dife the objects in the graph and then we give the tittle to the plot and we mark the x and y label accordingly and then we on the grid .
conclusion : hence we found the global maximaa of the given statement.
genetic algorithyum is a method for solving both constrained and unconstrained optimization problems based on a natural selection process that mimics biological evolution .the algorithym repeatdely modifies a population of individual solutionas and it is a repeatdely modifies a popuklation of individual from the current population and uses them as parents to produce the childern for the next generation