Project 1 - Parsing NASA thermodynamic data
AIM : To find the entropy enthalpy and the specific heat.
To plot the graphs of these respective values.
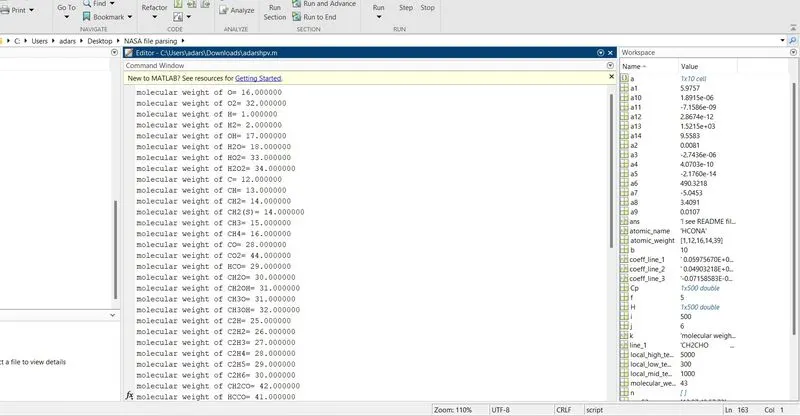
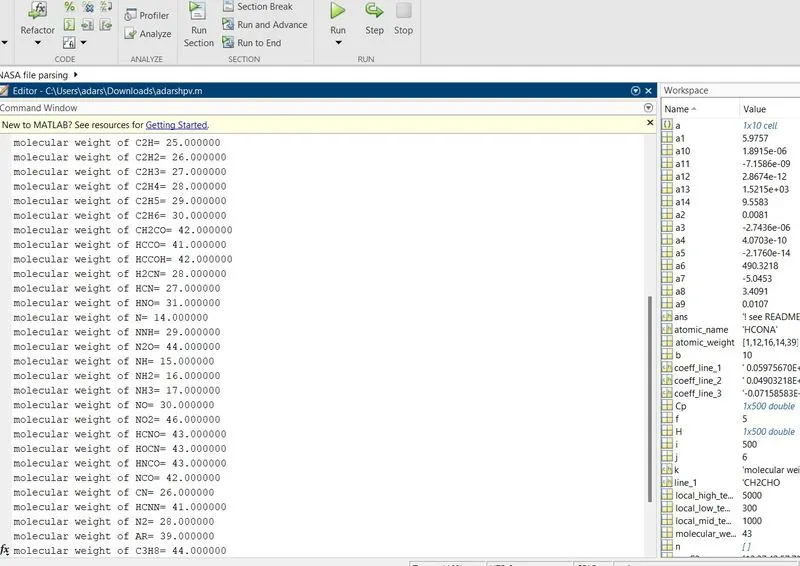
To find out the molecular weight of all the values.
THEORY: Intially we need to download the thermodat file and crosscheck the value that are to be considered in the file and load them to the matlab location.
clear all
close all
clc

%input gas constant
R=8.314;
%reading the fie
f = fopen('THERMO.dat','r');
% reading the header data
for i=1:5
    fgetl(f);
end
%read the species data
for j=1:53
    %from the species block set
    line_1 = fgetl(f);
        a=strsplit(line_1,' ');
        b=length(a);


        %extracting species name
        species_name=a{1};

        %extracting local temperature
        local_low_temp = a{b-3};
        local_high_temp = a{b-2};
        local_mid_temp =a{b-1};

        %extracting local temperature
        local_low_temp = str2num(local_low_temp);
        local_high_temp = str2num(local_high_temp);
        local_mid_temp = str2num(local_mid_temp);

        %extraction oof coefficients
        coeff_line_1= fgetl(f);

        % reading the position of E
        poseE1 = strfind(coeff_line_1,'E');

        a1= str2num(coeff_line_1(1:poseE1(1)+3));
        a2= str2num(coeff_line_1(poseE1(1)+4:poseE1(2)+3));
        a3= str2num(coeff_line_1(poseE1(2)+4:poseE1(3)+3));
        a4= str2num(coeff_line_1(poseE1(3)+4:poseE1(4)+3));
        a5= str2num(coeff_line_1(poseE1(4)+4:poseE1(5)+3));

        coeff_line_2=fgetl(f);
        posE2= strfind(coeff_line_2,'E');

        a6 = str2num(coeff_line_2(1:posE2(1)+3));
        a7 = str2num(coeff_line_2(posE2(1)+4:posE2(2)+3));
        a8 = str2num(coeff_line_2(posE2(2)+4:posE2(3)+3));
        a9 = str2num(coeff_line_2(posE2(3)+4:posE2(4)+3));
        a10 = str2num(coeff_line_2(posE2(4)+4:posE2(5)+3));

        coeff_line_3 = fgetl(f);
        posE3 = strfind(coeff_line_3,'E');

         a11 = str2num(coeff_line_3(1:posE3(1)+3));
         a12 = str2num(coeff_line_3(posE3(1)+4:posE3(2)+3));
         a13 = str2num(coeff_line_3(posE3(2)+4:posE3(3)+3));
         a14= str2num(coeff_line_3(posE3(3)+4:posE3(4)+3));

         %take input for temp
         T = linspace(local_low_temp,local_high_temp,500);

         %calculation of Cp,H,S

  for i=1:length(T)
     if T(i)>local_mid_temp
         Cp(i)= (a1+a2.*T(i)+a3.*T(i).^2+a4.*T(i).^3+a5.*T(i).^4)*R;
         H(i)= R*T(i).*(a1+((a2*T(i)/2))+((a3*T(i).^2)/3)+((a4*T(i).^3)/4)+((a5*T(i).^4)/5)+((a6./T(i))));
         S(i)= (a1.*log(T(i))+a2.*T(i)+a3.*(T(i)^2)/2+a4.*(T(i)^3)/3+a5.*(T(i)^4)/4+a7)*R;
     else
         Cp(i)= (a8+a9.*T(i)+a10.*T(i).^2+a11.*T(i).^3+a12.*T(i).^4)*R;
         H(i)= R*T(i).*(a8+((a9*T(i)/2))+((a10*T(i).^2)/3)+((a11*T(i).^3)/4)+((a12*T(i).^4)/5)+((a13./T(i))));
         S(i)= (a8.*log(T(i))+a9.*T(i)+a10.*(T(i)^2)/2+a11.*(T(i)^3)/3+a12.*(T(i)^4)/4+a14)*R;
     end
 end

%plotting and saving of the results
%saving the files and creating the folders
cd('C:\Users\adars\Desktop\NASA file parsing')
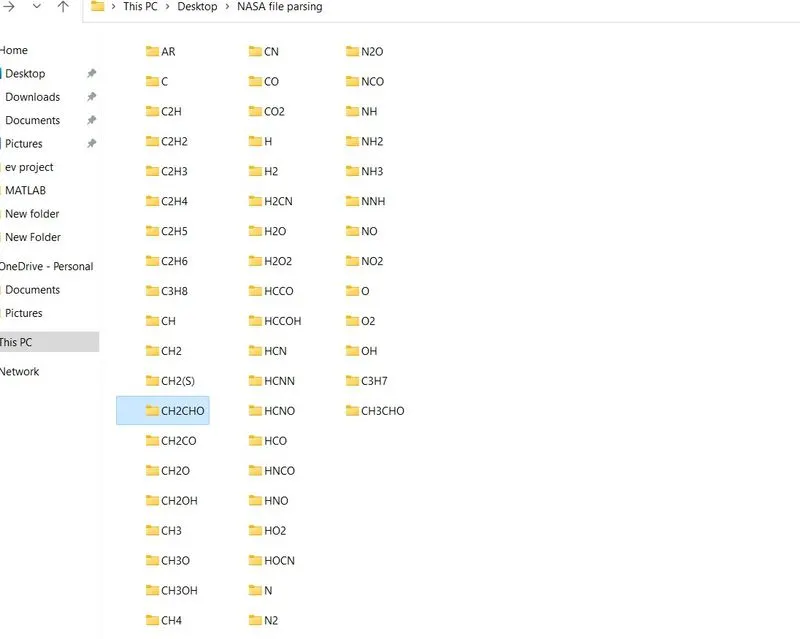
mkdir(species_name)
cd(species_name)
%plotting and saving the result
%plotting Temperature vs Specific Heat
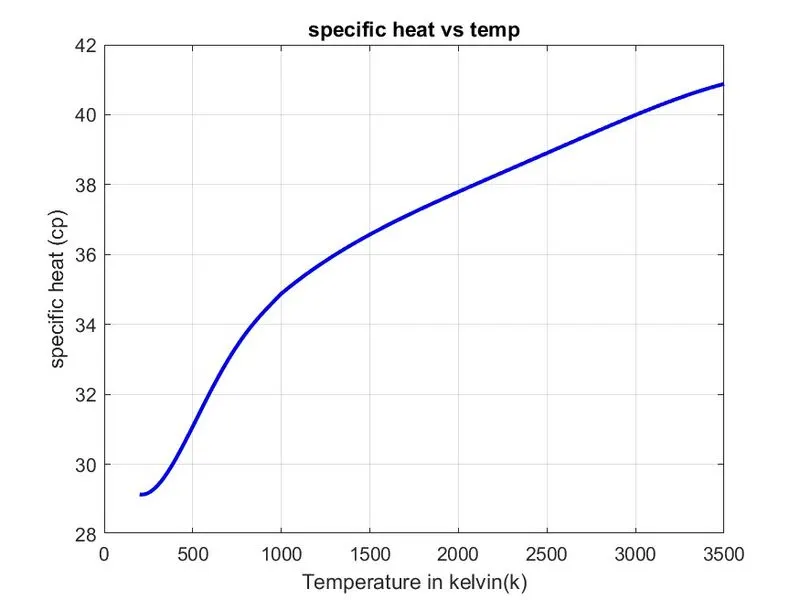
figure(1)
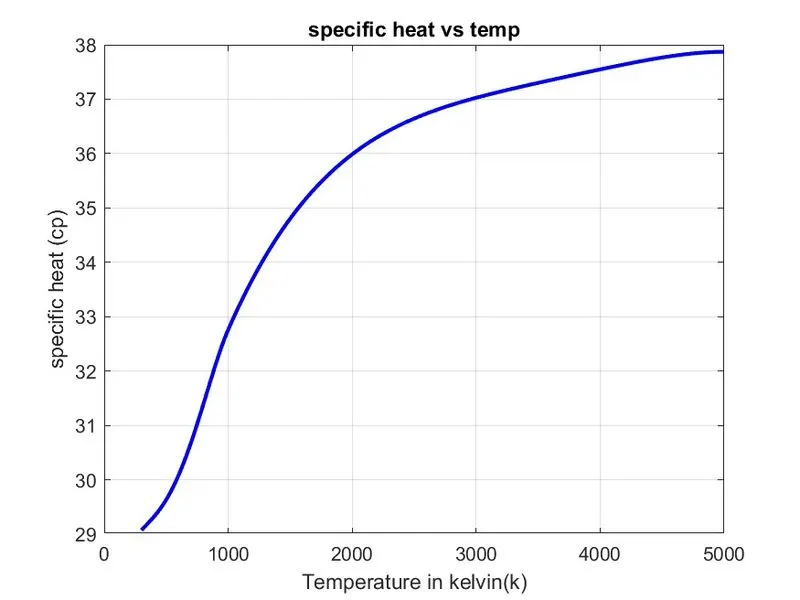
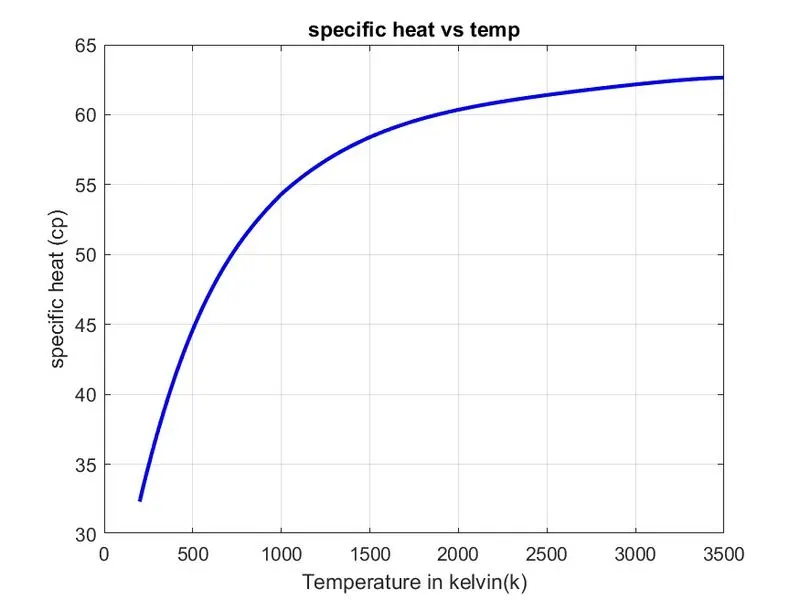
plot(T,Cp,'linewidth',2,'color','b')
xlabel('Temperature in kelvin(k)')
ylabel('specific heat (cp)')
grid on
title('specific heat vs temp')
saveas(figure(1),'specific heat.jpg')

%plotting Temperature vs Enthalpy
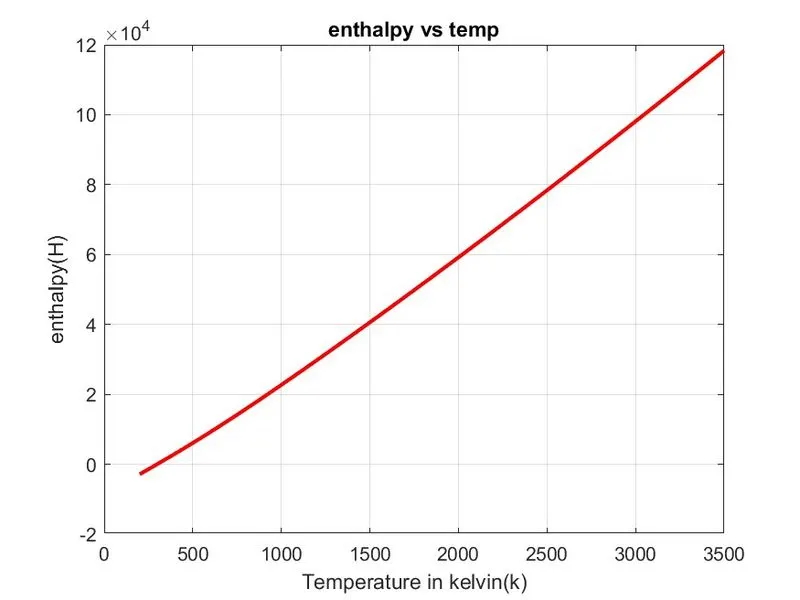
figure(2)
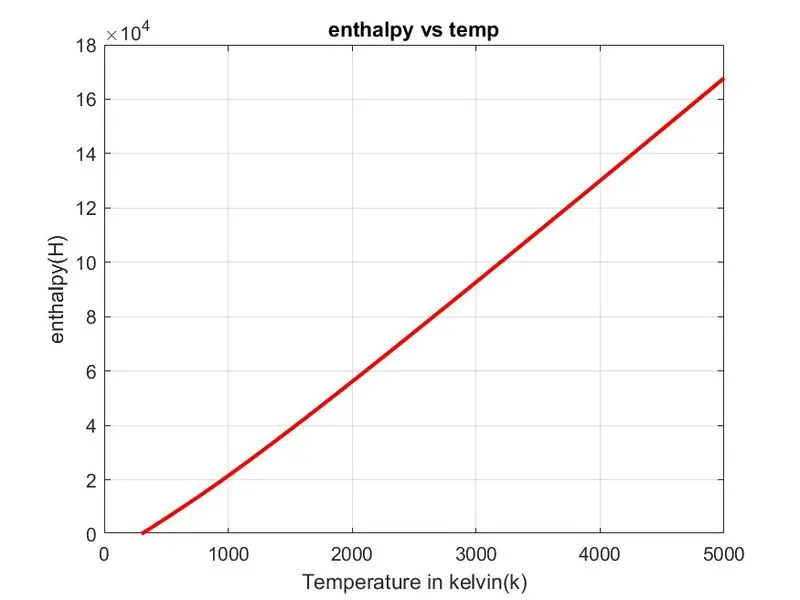
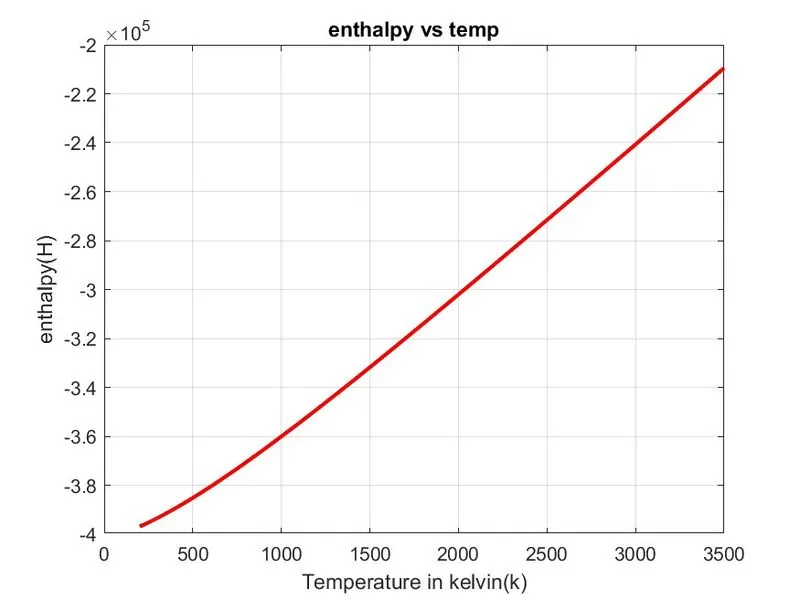
plot(T,H,'linewidth',2,'color','r')
xlabel('Temperature in kelvin(k)')
ylabel('enthalpy(H)')
grid on
title('enthalpy vs temp')
saveas(figure(2),'enthalpy.jpg')

%plotting Temperature vs Entropy
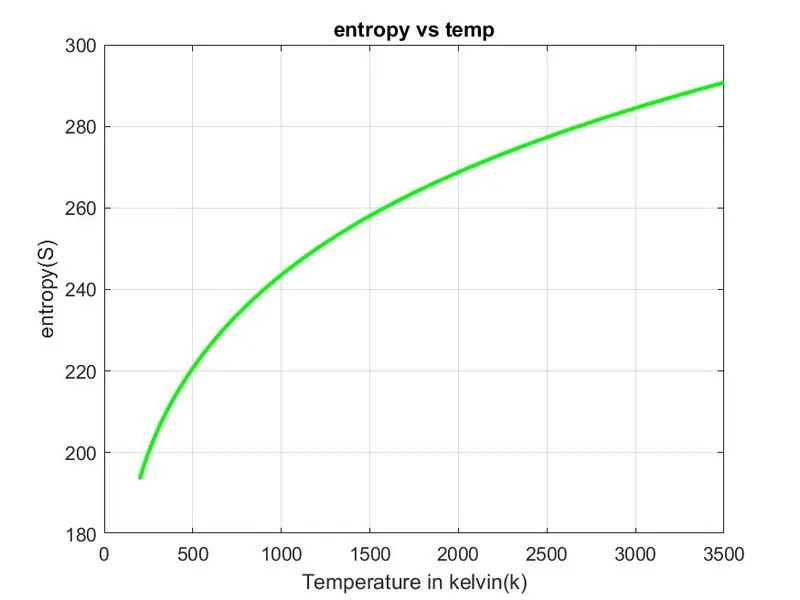
figure(3)
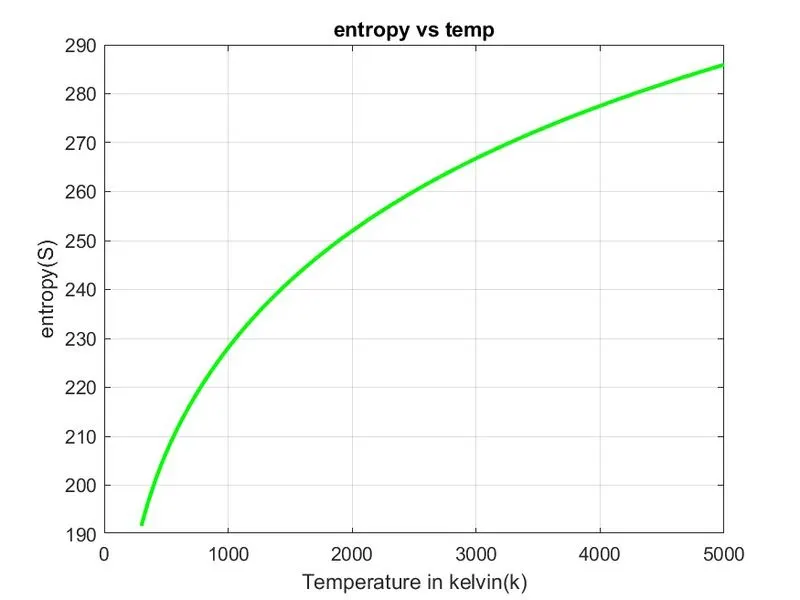
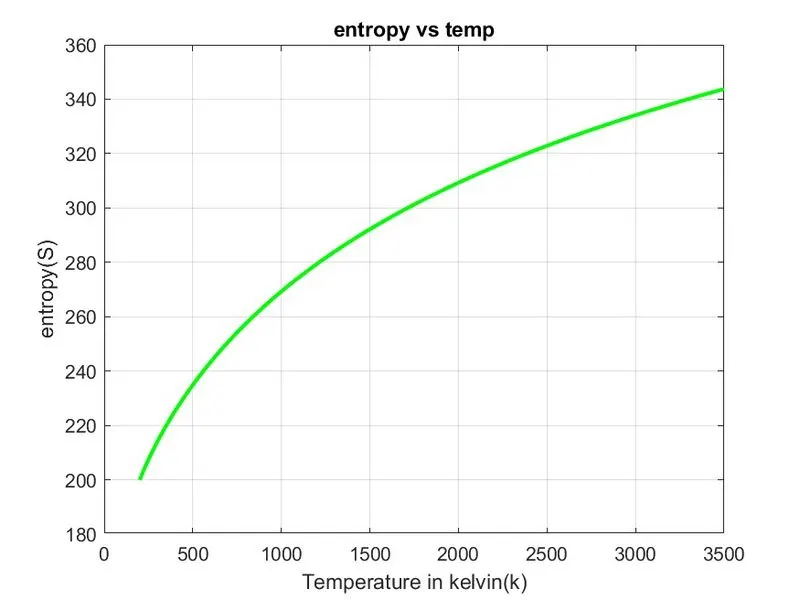
plot(T,S,'linewidth',2,'color','g')
xlabel('Temperature in kelvin(k)')
ylabel('entropy(S)')
grid on
title('entropy vs temp')
saveas(figure(3),'entropy.jpg')


% calculation of molecular weight
atomic_name= ['H','C','O','N','A'];
atomic_weight = [1,12,16,14,39];
molecular_weight = 0;

for j=1:length(species_name)
    for k= 1:length(atomic_name)
        if strcmp(species_name(j),atomic_name(k))
            molecular_weight = molecular_weight+atomic_weight(k);
            position=k;
        end
    end
    n=str2num(species_name(j));
    if (n>1)
        molecular_weight=molecular_weight+atomic_weight(position)*(n-1);
    end
end
k = sprintf('molecular weight of %s= %f',species_name,molecular_weight);%print statement
disp(k) %display statemnt in 'command window'

end
as always we would start with clear all close all and clc command so that the all the works and the results in the workspace and the command window are cleared.then we gve the input value for r which is the universal gas constant and after assigning the constant value we would open the nasa file by using the fopen command as a result the data can be opened in the matlab.after the introduction of the file we have a look over the file and makes a note of the values needed and then creates a for loop where we reduct the unwanted details from he file and the first five lnes are reducted and then creates a for loop with the remaining fifty three line left on the data file.the we start the code by slowly by considering each value by value by value and considers the first line and then we uses the fget command so that the line one is considered and then a strsplit command is used to remove the spacing within the values in the file and the then considers the value for b and accordingly the loop is created and the we use tto extract the local temperatures and the then we assign the values for local low temp,local medium temp and the local high temp.the the syntax for local low tem and others temp are calculated by the the use of the st2nuum command and within that the temperature value are found out.here we usess a technique of reading the position of the values and act accordingly in the file the common element is e so we take the position of e and then using that the codes are generated.herre by using this we would fingd the vaues of every element line by line so that single character is complected in this we uses the strfind command is used and in this syntax the with the position on the intial one the remaininf values are found out that is after the position of e the no of valures are found out and then the remaining element are or found accordingly we would find the value of the values the entire first set and then with is prnciple the remaing are calculated and tus the then we uses the lnspace command is used and values where each values are specified according the syntax and then we calculate the specific heat ,enthalpy and the entropy according to the formula given in the question so as earlier we calulate the value s for only within the first set of values and here in the formula we substitute the values accoring to the formulaand then we end the for loop there and then uses the plot syntaxes to plot the graphs and before plotting we would find the directory where the these plots are to be saved and then we would to define the location of the folder in the cd command and then mkdir commmand to specify the name of the life as the species name.the aoorrdingly we we would plot temp vs specific heat and the we plot the by line width of 2 amd a colour of blue accordingly remaining two plots are plotted.and in this for each set three graphs willl be plotted and these will be saved in jpg format.now we write a command to find out the molecular weight of these sets and here we specify the atomic anmes such as oxygen hydrogen nitrogen etc and their atomic weights are also registered and assign intially the molecular weight is zero.then we create a loop where we specify the value of k as the the length of the species name and then finds out the molecular molecular weight asthe sum of the molecular weight and the atomic weights.and then again uses str2num command to the species name where n less than one we give a condition simillarly the remaining value sare calculated and the the sprintf command is ues such thatbthe values are printed in the command window.
O2
N2
CO2
MOLECULAR WEIGHTS

CONCLUSION :HENCE THE RESULTS ARE PLOTED AND THE RESPECTIVE VALUES OF MOLECULAR WEIGHTS ARE CALCULATED.