Week 5 - Genetic Algorithm
AIM:-
- Write a code in MATLAB to optimise the stalagmite function and find the global maxima of the function.
- Clearly expalin the concept of genetic algorithm in your own words and also explain the syntax for ga in MATLAB in your report.
- Make sure that your code gives the same output, even if it is made to run several times.
- Plot graphs for all 3 studies and for F maximum vs no. of iterations. Title and axes labels are a must, legends could be shown if necessary.
OBJECTIVE:-
To Write a code in MATLAB to optimise the stalagmite function and find the global maxima of the function.
expalin the concept of genetic algorithm in your own words and also explain the syntax for ga in MATLAB.
Plot graphs for all 3 studies and for F maximum vs no. of iterations.
THEROY:-
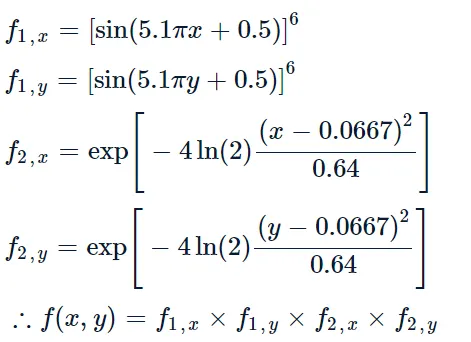
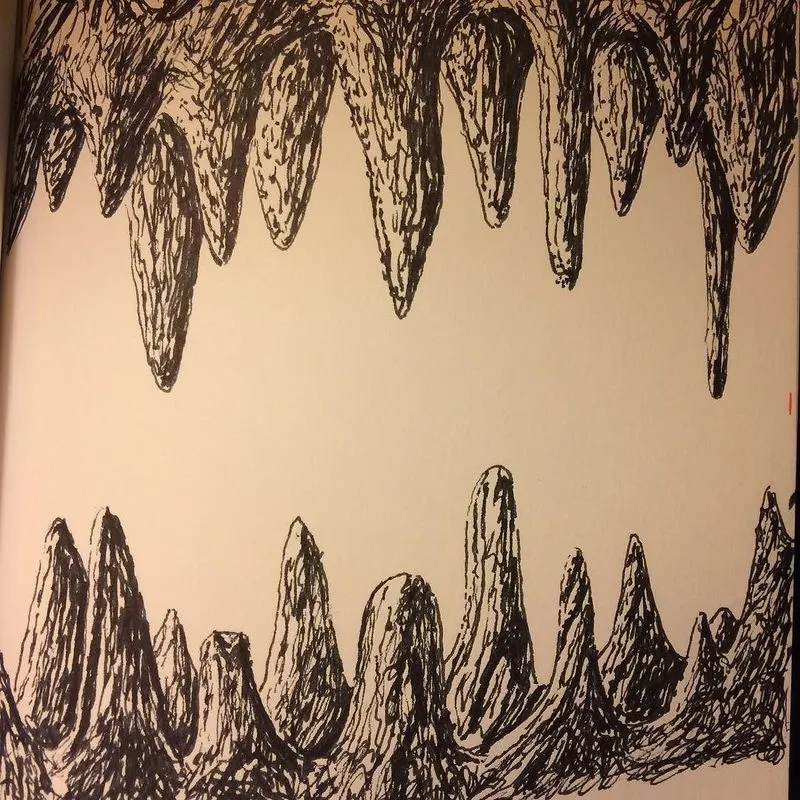
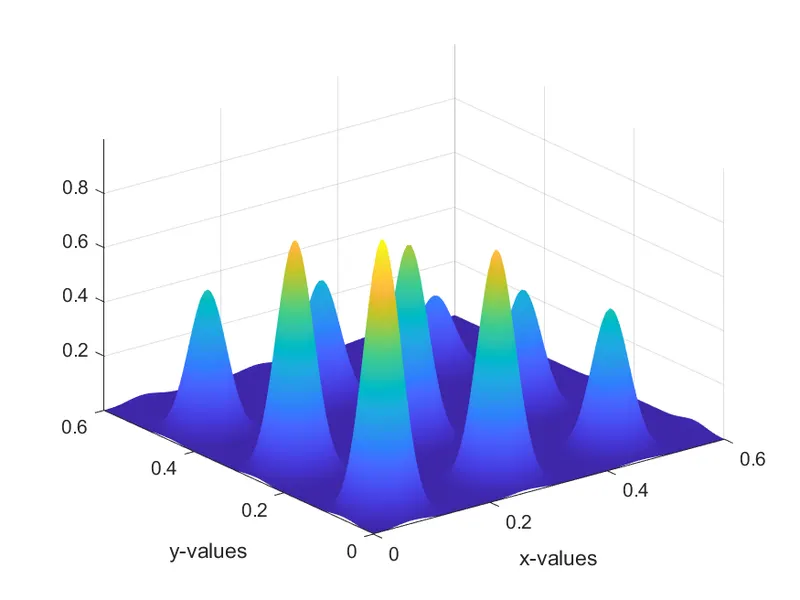
stalagmite A stalagmite is an upward-growing mound of mineral deposits that have precipitated from water dripping onto the floor of a cave. Most stalagmites have rounded or flattened tips. stalagmite function is a mathematical model which helps to generate local minima and maxima. It is a three dimensional function and the way the function is designed is that it has a lot of local maxima or minima and one global maxima or minima. The name stalagmite is actually a type of rock formation that arises from the floor of a cave due to the accumulation of material deposited on the floor from ceiling drippings.
Genetic algorithm A genetic algorithm is a search heuristic that is inspired by Charles Darwin's theory of natural evolution. This algorithm reflects the process of natural selection where the fittest individuals are selected for reproduction in order to produce offspring of the next generation.
Genetic algorithms are commonly used to generate high-quality solutions to optimization and search problems by relying on biologically inspired operators such as mutation, crossover and selection.
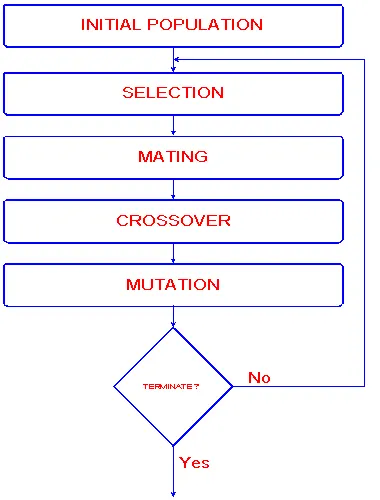
- The algorithm creates a random initial population at beginning.
- Then to create new population, the algorithm scores each member of the current population by computing its fitness value and converts them into a more usable range of values.
- Then based on these new values the algorithm selects members, called as parents.
- Then the algorithm produces children from the parents. Children are produced either by making random changes to a single parent which is mutation or by combining the vector entries of a pair of parents which is crossover.
- In this way the algorithm replaces the current population with the children to form the next generation.
- The algorithm stops when it reaches any one of the specified factors factors such as time limit, fitness limit, generations, function tolerance, constraint tolerance, etc.
syntax for ga
Find minimum of function using genetic algorithm. Here we are finding the maximum function values.
- study case 1
statistical behaviour
we are computing the function and the number of variables.
- study case 2
statistical behaviour of the upper and lower bounds
x = ga(fun,nvars,A,b,Aeq,beq,lb,ub)
we are computing the function, numbers of varibles, known eqaulity constrains and bounds.
- study case 3
statistical behaviour with lower upper bound, nonlcon,intcon and options.
x = ga(fun,nvars,A,b,Aeq,beq,lb,ub,nonlcon,intcon,options)
ERRORS:-
- I faced some syntax errors in starting and i resolved it perfectly.
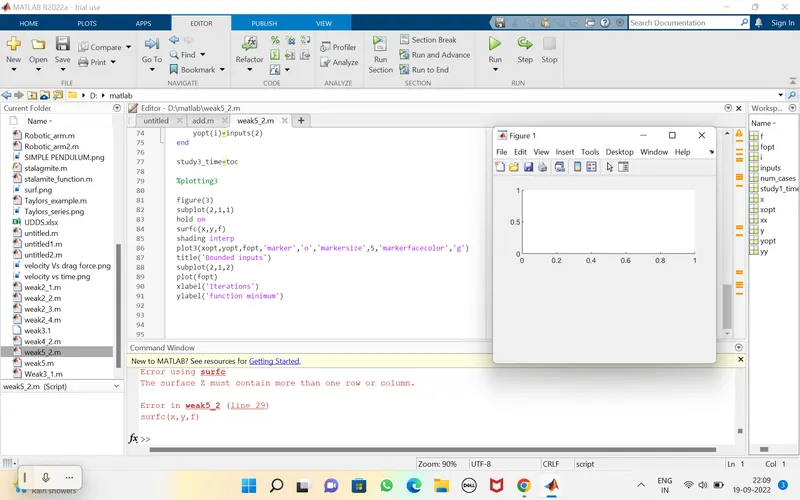
- Also i got some logical errors has given below and error is shown in the command window.
CODING PART:-
function code
function [f]=stalagmite(input_vector)

   x=input_vector(1);
   y=input_vector(2);
   f1_x = (sin(5.1*pi*x+0.5)).^6;
   f1_y = (sin(5.1*pi*y+0.5)).^6;
   f2_x = exp(-4*log(2)*(x-0.0667)^2/0.64);
   f2_y = exp(-4*log(2)*(y-0.0667)^2/0.64);

   f = -(f1_x)*(f1_y)*(f2_x)*(f2_y)

end
The global maxima of the function.
% To Write a code in MATLAB to optimise the stalagmite function and find the global maxima of the function.
clear all
close all
clc

x = linspace(0,0.6,160);                                % X variable from 0 to 160
y = linspace(0,0.6,160);                                % y variable from 0 to 160

[xx yy]= meshgrid(x, y);                                % conerting it into 2D array using meshgrid

for i= 1:length(xx)                                     % FOR loop from 1 to its length
    for j =1:length(yy)                                 % similarly for y variable
        input_vector(1)=xx(i,j);
        input_vector(2)=yy(i,j);
        f(i,j) = stalagmite(input_vector);              % calling the stalagmite function
    end                                                 % FOR ending
end                                                     % FOR ending

surfc(xx,yy,-f)                                         % ploting using surface command
xlabel('x-values');                                     % labeling x axis
ylabel('y-values');                                     % labeling y axis
shading interp                                          % removing the grid from plot
print('global maximum1','-dpng');                       % saving the plot into a image file png
[f,fval] = ga(@stalagmite,2);                           % using the genatic algorithm
coding part for all 3 studies
%programm to compute the Plot graphs for all 3 studies and for F maximum vs no. of iterations.
clear all
close all
clc

x=linspace(0,0.6,150);                                  % X variable from 0 to 160
y=linspace(0,0.6,150);                                  % y variable from 0 to 160

[xx,yy]= meshgrid(x,y);                                 % conerting it into 2D array using meshgrid

num_cases=150;

for i= 1:length(xx)                                    % FOR loop from 1 to its length
    for j =1:length(yy)                                % similarly for y variable
        input_vector(1)=xx(i,j);
        input_vector(2)=yy(i,j);
        f(i,j) = stalagmite(input_vector);             % calling the stalagmite function
    end                                                % FOR ending
end                                                    % FOR ending


tic                                                   % tic function records the current time
%study 1 - statistical behavior
for i = 1:num_cases                                   % FOR loop is calculate 1 to its no.of cases
    [inputs,fopt(i)] = ga(@stalagmite,2);             % x = ga(fun,nvars)
    xopt(i) = inputs(1);
    yopt(i) = inputs(2);
end                                                   % FOR ending

study1_time = toc;                                   % toc function uses the recorded value to calculate the elapsed time.

figure(1)                                            % creating figure 1
subplot(2,1,1)                                       % subploting
hold on                                              % holding the plot
surfc(x,y,-f)                                        % surface plot
shading interp                                       % to remove the grid lines using shading interp
plot3(xopt,yopt,-fopt,'marker','o','markersize',5,'markerfacecolor','g');  % ploting 3D  plot
title('Unbounded inputs');                           % ading title to the plot
subplot(2,1,2);
plot(-fopt);
xlabel('Iterations');                                % labeling x values
ylabel('function minimum');                          % labelimg y values


%% coding part is same as the study 1 but changing the ga function syntax
 tic
%study 2 -statistical behaviour
 for i = 1:num_cases
     [inputs,fopt(i)] = ga(@stalagmite,2,[],[],[],[],[0;0],[1;1]);      % x = ga(fun,nvars,A,b,Aeq,beq,lb,ub)
     xopt(i) = inputs(1);
     yopt(i) = inputs(2);
end

study2_time = toc;

figure(2)
subplot(2,1,1)
hold on
surfc(x,y,-f)
shading interp
plot3(xopt,yopt,-fopt,'marker','o','markersize',3,'markerfacecolor','g')
title('Bounded inputs')
subplot(2,1,2)
plot(-fopt)
xlabel('Iterations')
ylabel('function minimum')


%% same as study 1 but changing the stalagmite function and incresing the population
%increrasing ga iteration
options=optimoptions('ga');
options=optimoptions(options,'populationsize',500);

tic
%study- statatical behaviour
for i=1:num_cases
 [inputs,fopt(i)] = ga(@stalagmite,2,[],[],[],[],[0;0],[0.4;0.4],[],[],options);        % x = ga(fun,nvars,A,b,Aeq,beq,lb,ub,nonlcon,intcon,options)
    xopt(i) = inputs(1);
    yopt(i) = inputs(2);
end

study3_time = toc;

figure(3)
subplot(2,1,1)
hold on
surfc(x,y,-f)
shading interp
plot3(xopt,yopt,-fopt,'marker','o','markersize',5,'markerfacecolor','g')
title('Bounded inputs')
subplot(2,1,2)
plot(-fopt)
xlabel('Iterations')
ylabel('function minimum')
RESULTS:-
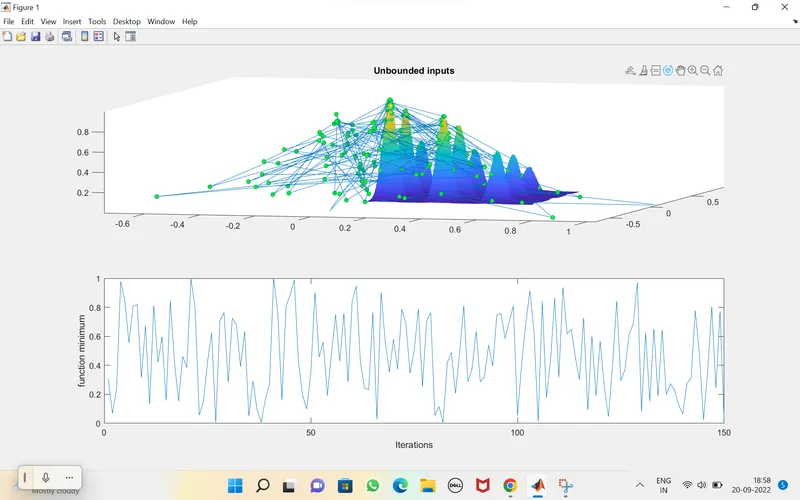
In the above image it can be seen that since the inputs are boundless GA algorithm has mapped local maxima points outside our stalagmite function. Also we cannot infer a particular value of global maxima from the above graph, and it is hence pointless.
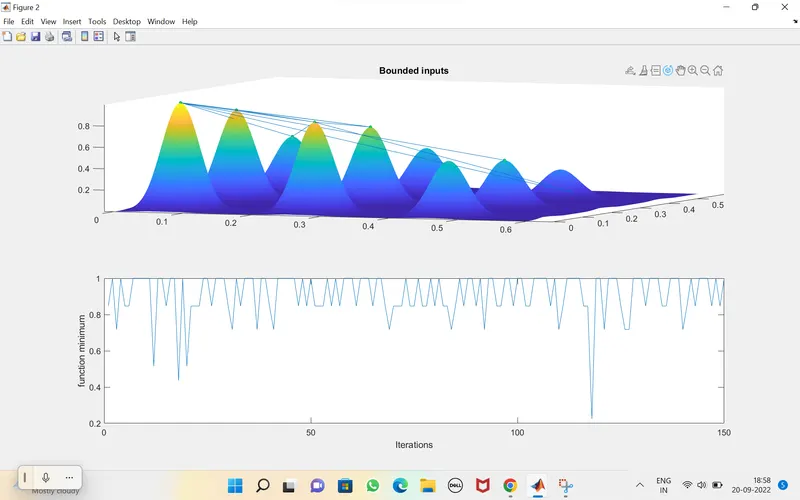
The above graph is more clear and optimised compared to the 1st iteration since here the bounds were defined and we could get only the values within our range. We are now more clear on the range within which our maxima lies.
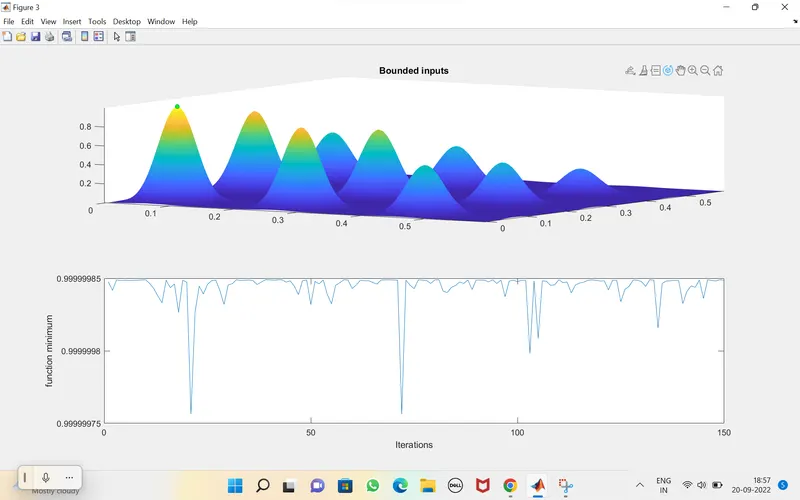
In this case we are getting the optimised value of global maxima with accurate range, since we increased the number of iterations and population size. Since the number of iterations and population size is increased the study time is so high compared to the previous two iterations.
REFERANCES:-