Week 5 - Genetic Algorithm
REPORT:
Aim: To Write a code in MATLAB to optimise the stalagmite function and find the global maxima of the function.
Objective: To Clearly expalin the concept of genetic algorithm in your own words and also explain the syntax for ga in MATLAB in your report. Plot graphs for all 3 studies and for F maximum vs no. of iterations.
Genetic algorithm: It provides how does the next generation will be generated from the previous generation.
It is the in-built function in MATLAB.
It Provides three studies mention below
- Selection rules.
- Crossover rules.
- Mutation rules.
Body of the report:
Software: MATLAB software is used.
Program:
clear all
close all
clc

%defining our search
x = linspace(0,0.6,150);
y = linspace(0,0.6,150);

[xx yy] = meshgrid(x,y);

%evaluating the stalagmite function
for i = 1 : length(xx);
    for j = 1:length(yy);
        input_vector(1)= xx(i,j);
        input_vector(2)= yy(i,j);
        f(i,j) = stalagmite_fun(input_vector);
    end
end

surf(xx, yy, f)
shading interp

xlabel('x value')
ylabel('y value')
colorbar
title('surf plot')
[x_output , fval] = ga(@stalagmite_fun,2);
Stalagmite function program:
%stalagmite function
function [stalagmite] = stalagmite_fun(input_vector)
x = input_vector (1)
y = input_vector (2)
f1_x = (sin(5.1*pi*x + 0.5)).^6;
f2_y = (sin(5.1*pi*y + 0.5)).^6;
f3_x = exp((-4*0.6931).*(x-0.0667)^2/(0.64));
f4_y = exp((-4*0.6931).*(y-0.0667)^2/(0.64));
stalagmite = (f1_x.*f2_y.*f3_x.*f4_y)
end
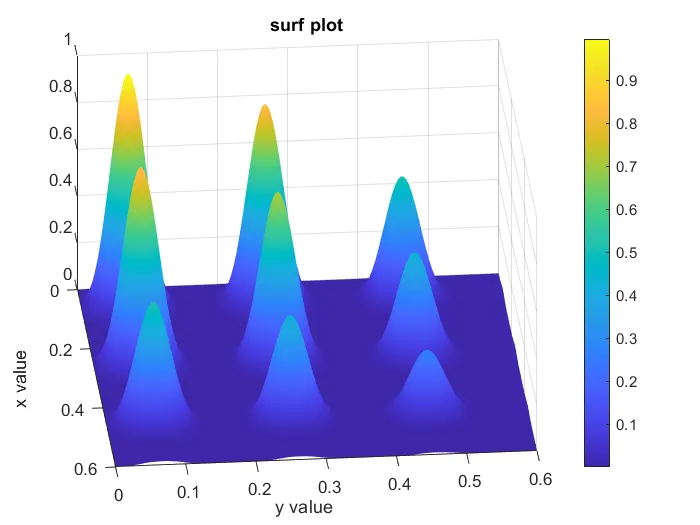
Inputs 'x' and 'y' are assigned by using linspace command and then 2-dimenssional array is generated using meshgrid command. nested for loop command is for repetative vector data formation and executed by calling stalagmite function (stalagmite_fun.m). Then Surf command is used for plotting the function and shading interp command is used to get smothern plot. Outputs for next generation are generated using Genetic algorithm function.
Program:
clear all
close all
clc

%defining our search
x = linspace(0,0.6,150);
y = linspace(0,0.6,150);
num_cases = 50;

[xx yy] = meshgrid(x,y);

%evaluating the stalagmite function
for i = 1 : length(xx)
    for j = 1:length(yy)
        input_vector(1)= xx(i,j);
        input_vector(2)= yy(i,j);
        f(i,j) = stalagmite_fun(input_vector);
    end
end

%study 1 statistical behaviour
tic
for i = 1:num_cases
    [inputs,Fopt(i)] = ga(@stalagmite_fun,2);
    xopt(i) = inputs(1);
    yopt(i) = inputs(2);
end

study_time_1 = toc;

%plotting
figure(1)
subplot(2,1,1);
hold on
surfc(xx,yy,f);
shading interp;

ylabel('Y data');
xlabel('X data');
plot3(xopt,yopt,Fopt,'marker','o','markersize',5,'markerfacecolor','y')
title('Unbounded Inputs')
subplot(2,1,2)
plot(Fopt)
xlabel('Iterations')
ylabel('Maximum function')


%study_2 bounding the values

tic
for i = 1:num_cases
[inputs,Fopt(i)] = ga(@stalagmite_fun,2,[],[],[],[],[0;0],[1;1]);
xopt(i) = inputs(1);
yopt(i) = inputs(2);
end
study_time_2 = toc;

figure(2)
subplot(2,1,1)
hold on
surfc(xx,yy,f)
shading interp
xlabel('X data')
ylabel('Y data')
plot3(xopt,yopt,Fopt,'marker','o','markersize',5,'markerfacecolor','r');
title('Bounded Inputs')
subplot(2,1,2)
plot(Fopt)
xlabel('Iterations')
ylabel(' Maximum Function')

%study_3 bounding the values and increasing population size

options = optimoptions('ga');
options = optimoptions(options,'populationsize',300);
tic
for i = 1:num_cases
[inputs,Fopt(i)] = ga(@stalagmite_fun,2,[],[],[],[],[0;0],[1;1],[],[],options);
xopt(i) = inputs(1);
yopt(i) = inputs(2);
end

study_time_3 = toc;

figure(3)
subplot(2,1,1)
hold on
surfc(xx,yy,f)
shading interp
xlabel('X data')
ylabel('Y data')
plot3(xopt, yopt,Fopt,'marker','o','markersize',5,'markerfacecolor','g');
title('Bounded Inputs with Increased population size');
subplot(2,1,2)
plot(Fopt)
xlabel('Iterations');
ylabel('Maximum Function');
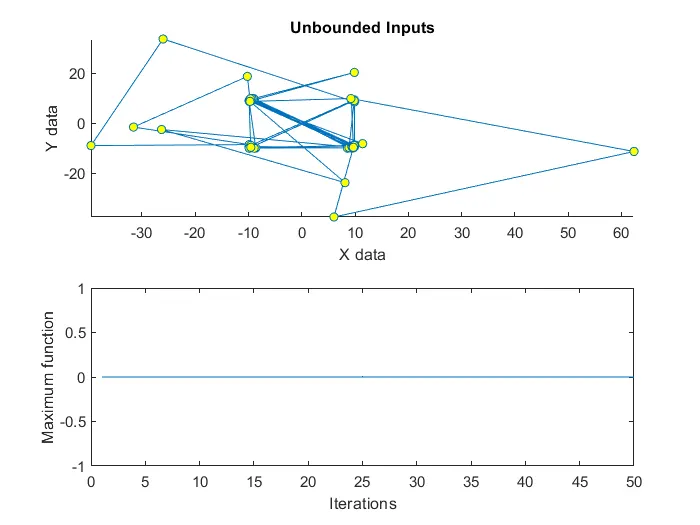
Study 1: Unbounded values
plot:
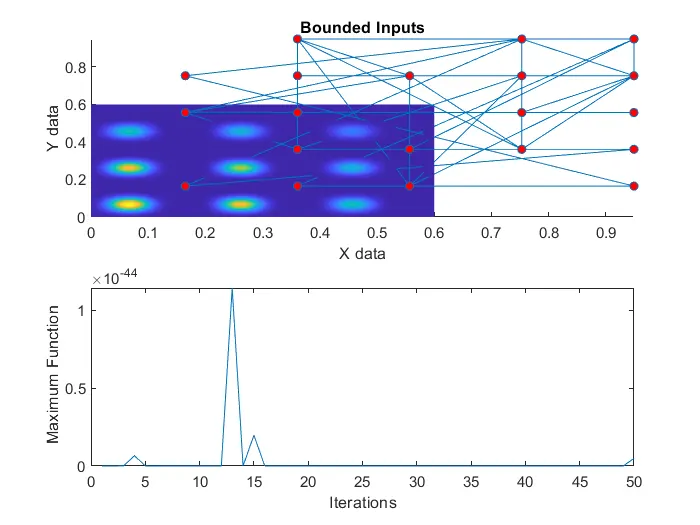
Study 2: Bounded values
plot:
Study 3: Bounded inputs with increased population.
plot:
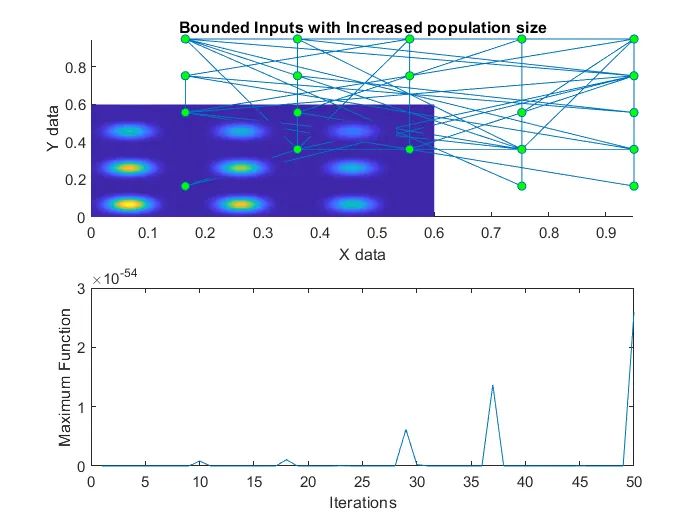
Conclusion: Presented results(plots) shows experimental study of all three studies of Genetic algorithm which shows statistically that the optimization of the code has been done.