Project 1 - Parsing NASA thermodynamic data
REPORT:
Aim: To Parsing NASA thermodynamic data
Objective: To
- Write a function that extracts the 14 co-efficients and calculates the enthalpy, entropy and specific heats for all the species in the data file.
- Calculate the molecular weight of each species and display it in the command window.
- Plot the Cp, Enthalpy and Entropy for the local temperature range (low temperature : high temperature) specific for each species.
Equations:
- Cp/R = a1 + a2*T + a3*T^2 + a4*T^3 + a5*T^4 ....( to calculate specific heat)
- H/RT = a1 + a2*T /2 + a3*T^2 /3 + a4*T^3 /4 + a5*T^4 /5 + a6/T ....(to calculate enthalpy)
- S/R = a1*lnT + a2*T + a3*T^2 /2 + a4*T^3 /3 + a5*T^4 /4 + a7 ....(to calculate entropy)
File parsing: File parsing means to read data from the text file or any kind of file and use it in computer programs to get the required output. NASA THERMODYNAMIC file (THERMO.dat) file is a data file containing 14 coefficients which are used to calculate Entropy(S) ,Enthalpy(H) , and Specific heat(Cp) of particular elements. first 7 coefficients are high-temperature coefficients and last 7 coefficients are low-temperature coefficients. Each element has its own range of local temperature.
Enthalpy: a thermodynamic quantity equivalent to the total heat content of a system. It is equal to the internal energy of the system plus the product of pressure and volume.
Entropy: the measure of a system's thermal energy per unit temperature that is unavailable for doing useful work. Because work is obtained from ordered molecular motion, the amount of entropy is also a measure of the molecular disorder, or randomness, of a system.
Specific Heat: It is the amount of energy that must be added in the form of heat to one unit of mass of the substance in order to cause an increase of one unit in its temperature.
Body of the report:
Software: MATLAB software is used to get required output.
Programs:
1. Function to calculate Enthalpy:
% Enthalpy calculation function

function H = Enthalpy(a1,a2,a3,a4,a5,a6,a8,a9,a10,a11,a12,a13,Temp,R,global_medium_temp)
% comparing with global temperature
% if less than global temperature - minimum coefficients are taken

if Temp <= global_medium_temp
    H = R*Temp.*(a8 + ((a9*Temp)/2) + ((a10*(Temp).^2)/3) + ((a11*(Temp).^3)/4) + ((a12*(Temp).^4)/5) + ((a13./Temp)));
else
    % else maximum coefficients are taken
    H = R*Temp.*(a1 + ((a2*Temp)/2) + ((a3*(Temp).^2)/3) + ((a4*(Temp).^3)/4) + ((a5*(Temp).^4)/5) + ((a6./Temp)));
end
2. Function to calculate Entropy:
% Entropy calculation function

function S = Entropy_calc(a1,a2,a3,a4,a5,a7,a8,a9,a10,a11,a12,a14,Temp,R,global_medium_temp)
% comparing with global temperature
% if less than global temperature - minimum coefficients are taken

if Temp <= global_medium_temp
    S = R.*(a8.*log(Temp) + (a9.*Temp) + (a10*((Temp).^2)/2) + (a11*((Temp).^3)/3) + (a12*((Temp).^4)/4) + a14);
else
    % else - maximum coefficients are taken
     S = R.*(a1.*log(Temp) + (a2.*Temp) + (a3*((Temp).^2)/2) + (a4*((Temp).^3)/3) + (a5*((Temp).^4)/4) + a7);
end
3. Function to calculate Specific heat:
% specific heat calculation function

function Cp = specificheat(a1,a2,a3,a4,a5,a8,a9,a10,a11,a12,Temp,R,global_medium_temp)
% comparing with global temperature
% if less than global temperature - minimum coefficients are taken
if Temp <= global_medium_temp
    Cp = R*(a8 + (a9*temp) + (a10*(Temp).^2) + (a11*(Temp).^3) + (a12*(Temp).^4));
else
    Cp = R*(a1 + (a2*Temp) + (a3*(Temp).^2) + (a4*(Temp).^3) + (a5*(Temp).^4));
    % else maximum coefficients are taken
end
4. Function to calculate Molecular weight:
% Molecular Weight calculation function

function Molecularweight = Molecular_weight(Species_SP)
% Standard - Atomic Name
atomic_name = ['H','C','O','N','A'];
% Hydrogen, Carbon, Oxygen, Nitrogen, Argon

fprintf('Molecular Weight of ');
fprintf(Species_SP);
fprintf(' : ');
% Standard Atomic Number
Atomic_Weight = [1.008 12.001 15.999 14.007 39.948];
% Starting Range of molecule
Molecularweight = 0;

% adding Atomic number to obtain particular value
for i = 1:length(Species_SP)
    for j = 1:length(atomic_name)
        if strcmpi(Species_SP(i),atomic_name(j))
            Molecularweight = Molecularweight + Atomic_Weight(j);
            position = j;
        end
    end
    n = str2num(Species_SP(i));
    if n>1
        Molecularweight = Molecularweight + Atomic_Weight(position)*(n-1);
    end
end
fprintf('molecular weight %s :',Species_SP);
fprintf('%d',Molecularweight);
disp(' ');
end
5. Main program(code) to get required Objective:
clear all
close all
clc

% make directory
mkdir 'D:\Matlab\project 1 file parsing'

f1 = fopen('THERMO.dat','r')
gt = fgetl(f1);

% Reading header information
global_temp = fgetl(f1);
t = strsplit(global_temp);

% converting string cell to numbers using str2num,
global_low_temp = str2num(t{2});
global_medium_temp = str2num(t{3});
global_high_temp = str2num(t{4});

% Temperature range
Temp = linspace(global_low_temp,global_high_temp,1000);
% Universal gas constant J/(Mol-K)
R = 8.314

% skipping three comments line in the file
for i = 1:3
    gt = fgetl(f1);
end

for i = 1:53
    gt = fgetl(f1);
    A = strsplit(gt,' ');
    Species_SP = (A{1})

    line_1=fgetl(f1);
    a= strfind(line_1,'E');

    % % Extracting first 7 coefficients i.e. high-temperature coefficients
    a1 = line_1(1:a(1)+3);
    a1 = str2num(a1);             %1
    a2 = line_1(a(1)+4:a(2)+3);
    a2 = str2num(a2);             %2
    a3 = line_1(a(2)+4:a(3)+3);
    a3 = str2num(a3);             %3
    a4 = line_1(a(3)+4:a(4)+3);
    a4 = str2num(a4);             %4
    a5 = line_1(a(4)+4:a(5)+3);
    a5 = str2num(a5);             %5

    line_2=fgetl(f1);
    b=strfind(line_1,'E');
    a6 = line_2(1:b(1)+3);
    a6 = str2num(a6);             %6
    a7 = line_2(a(1)+4:b(2)+3);
    a7 = str2num(a7);             %7

 % % Extracting second 7 coefficients i.e. low-temperature coefficients
    a8 = line_2(b(2)+4:b(3)+3);
    a8 = str2num(a8);             %8
    a9 = line_2(b(3)+4:b(4)+3);
    a9 = str2num(a9);             %9
    a10 = line_2(b(4)+4:b(5)+3);
    a10 = str2num(a10);           %10

    line_3=fgetl(f1);
    c=strfind(line_1,'E');

    a11 = line_3(1:c(1)+3);
    a11 = str2num(a11);           %11
    a12 = line_3(c(1)+4:c(2)+3);
    a12 = str2num(a12);           %12
    a13 = line_3(c(2)+4:c(3)+3);
    a13 = str2num(a13);           %13
    a14 = line_3(c(3)+4:c(4)+3);
    a14 = str2num(a14);           %14

    % Specific heat calculation
    Cp = specificheat(a1,a2,a3,a4,a5,a8,a9,a10,a11,a12,Temp,R,global_medium_temp);

    % Enthalpy calculation
    H = Enthalpy(a1,a2,a3,a4,a5,a6,a8,a9,a10,a11,a12,a13,Temp,R,global_medium_temp);

    % Entropy calculation
    S = Entropy_calc(a1,a2,a3,a4,a5,a7,a8,a9,a10,a11,a12,a14,Temp,R,global_medium_temp);

    % Calculating molecular weight of species
    Molecularweight(i) = Molecular_weight(Species_SP);

    % read and write molecular list
    molecular_list = fopen('Molecular weight.txt','a+');
    fprintf( molecular_list, 'Molecular weight of %s is %d \n',Species_SP,Molecularweight);
    fclose(molecular_list);

    % plotting (CP,H,S,Temp,Species_SP)
    % Saving as a folder

    cur_dir=pwd;

    cd(Species_SP);

    % plot 1, Specific heat (CP) vs Temperature Range (Temp)

    figure(1)
    plot(Temp,Cp,'LineWidth',2,'Color','r');
    xlabel('Temperature [K]');
    ylabel('Specific Heat [KJ]');
    title(sprintf('Varying Specific Heat with Temperature Range of %s',Species_SP));
    grid on
    saveas(figure(1),'Specific Heat.jpg');

    % plot 2, Enthalpy (H) vs Temperature Range (Temp)

    figure(2)
    plot(Temp,H,'LineWidth',2,'Color','g');
    xlabel('Temperature [K]');
    ylabel('Enthalpy [KJ/(mol)]');
    title(sprintf('Varying Enthalpy with Temperature Range of %s',Species_SP));
    grid on
    saveas(figure(2),'Enthalpy.jpg');

    % plot 3, Entropy (S) vs Temperature Range (Temp)

    figure(3)
    plot(Temp,S,'LineWidth',2,'Color','g');
    xlabel('Temperature [K]');
    ylabel('Entropy [KJ/(mol-K)]');
    title(sprintf('Varying Entropy with Temperature Range of %s',Species_SP));
    grid on
    saveas(figure(3),'Entropy.jpg');

    cd(cur_dir);

    % Molecular weight

    M = Molecular_weight(Species_SP)
    f2 = fopen('molecular mass','w');
    fprintf('%s n %s n %f n','Species','Molecular mass',M)
    fclose(f2)
end- Firstly, The function code to calculate Entropy, Enthalpy, Specific Heat, and Molecular Weight has been written.
- 'clear all' to clear all the variables in the workspace, 'close all' to close all the previous plots and figures, and 'clc' to clears the command window.
- Making a directory using 'mkdir' with location address.
- Reading the file 'THERMO.dat' and opening it using 'fopen' and 'r' is used to read the file.
- 'fgetl' to read the specific line in data file.
- 'strsplit' to split the temperature into string cell obtained from data file.
- 'str2num' to convert the string cell to numbers.
- Divided the temperature into a string and then converted to a number so that temperature values can be used separately to solve the NASA thermodynamics.
- Used 'for & end' loops to skip the next three comment lines in the text file.
- Reading all the 53 species to plot specific heat(cp), enthalpy(H), and entropy(S), with temperature values, and to find the molecular weights.
- Used 'for' loop to read 53 species.
- Used 'strfind' to find string.
- Using 'linspace' specified the temperature range from low to high.
- Adding universal gas constant value 'R'.
- Extracted higher and lower temperature coefficients by reading line by line from the species.
- Calling Specific Heat, Enthalpy, Entropy function codes.
- Calculating Molecular weight.
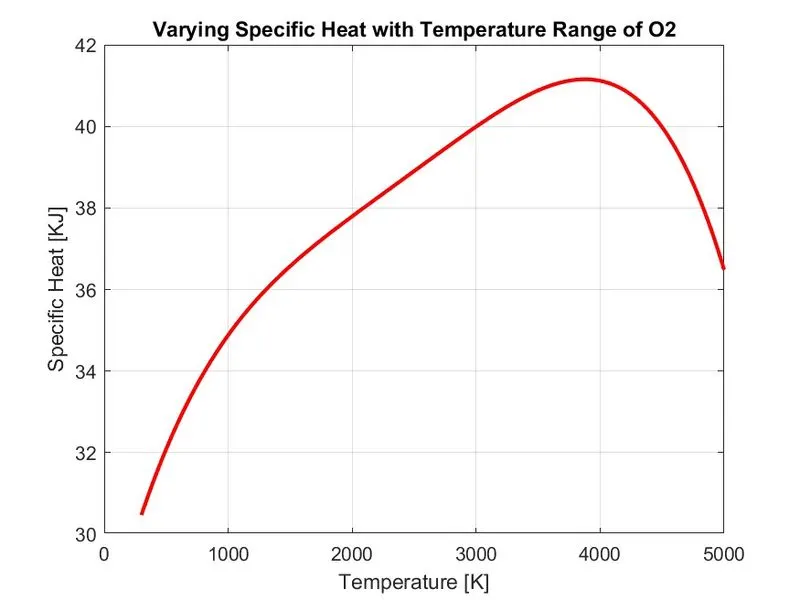
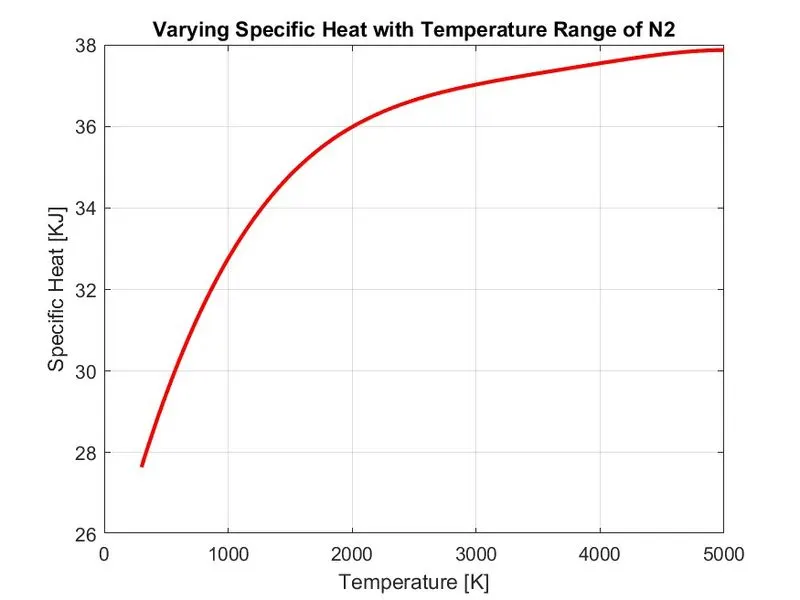
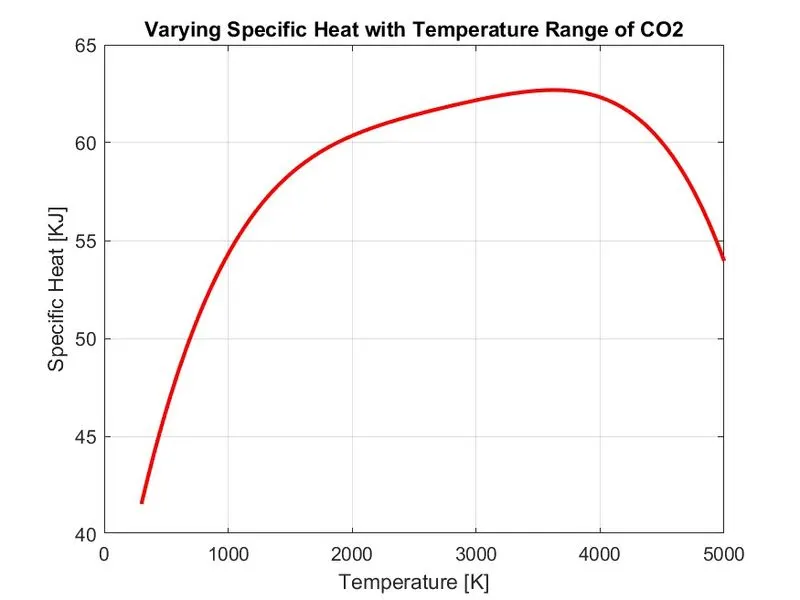
- plot 1 shows the plots of Specific heat(Cp) vs Temperature range(Temp).
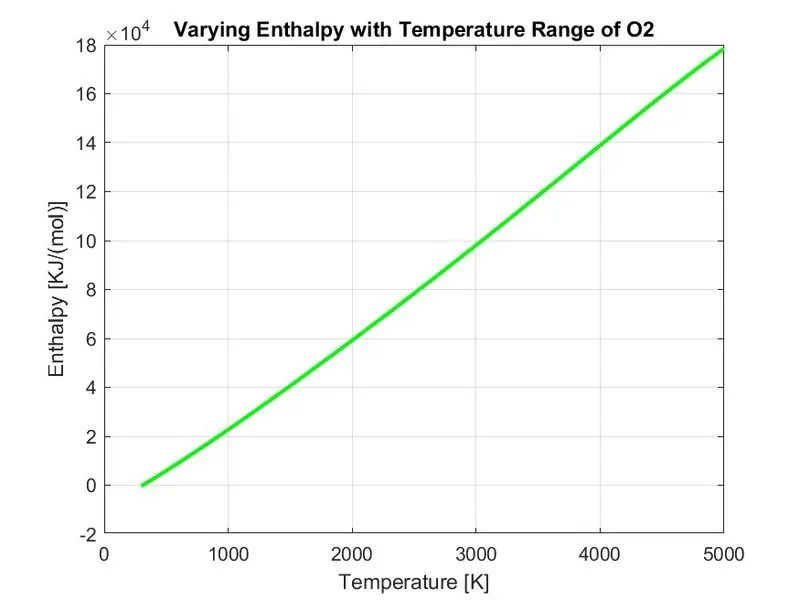
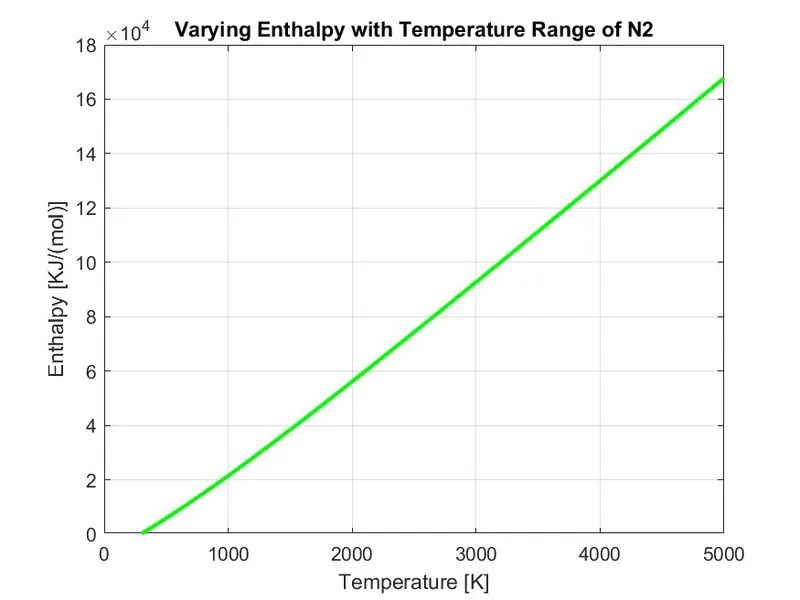
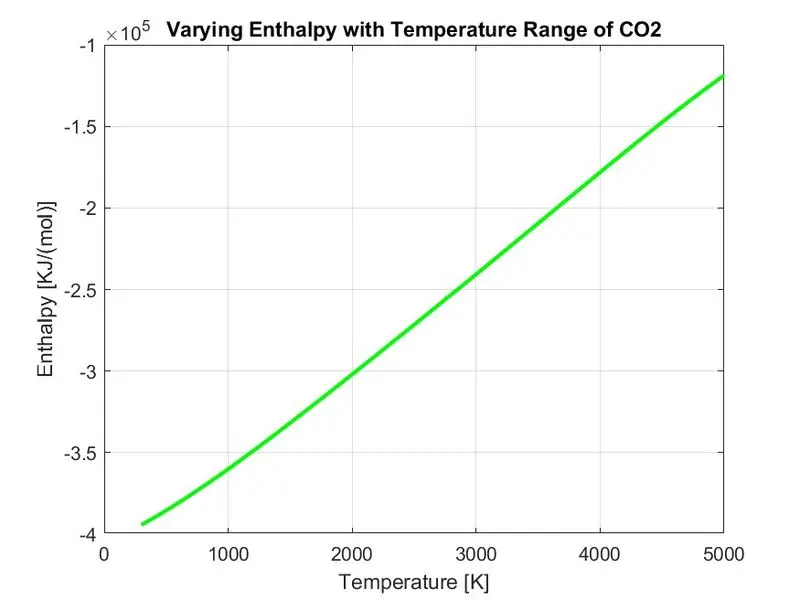
- plot 2 shows the plots of Enthalpy(H) vs Temperature range(Temp).
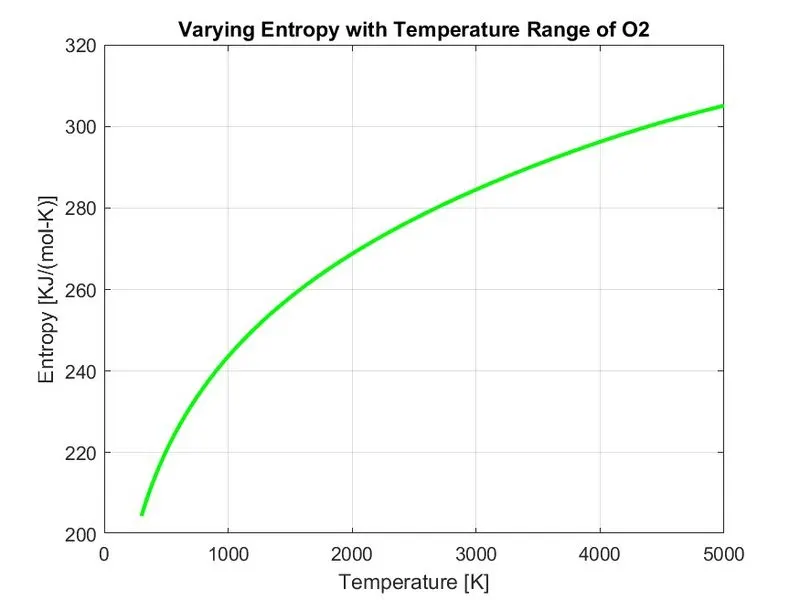
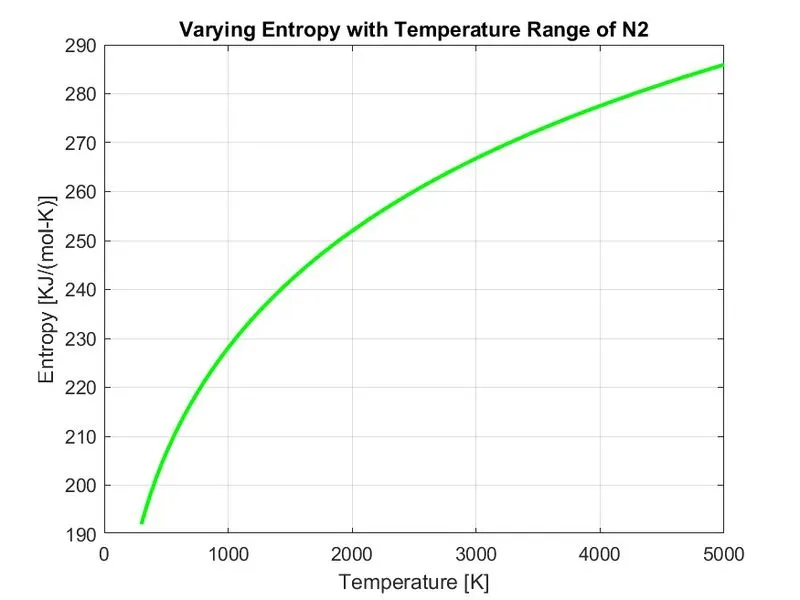
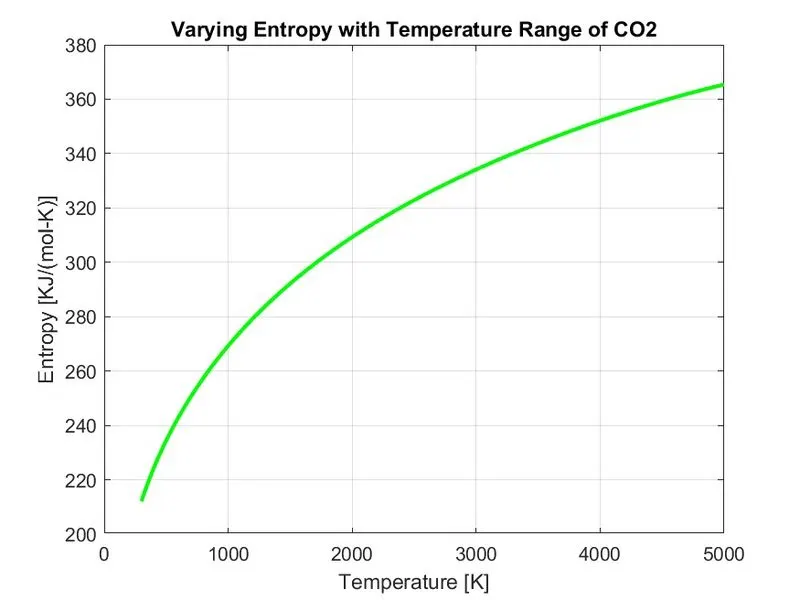
- plot 3 shows the plots of Entropy(S) vs Temperature range(Temp).
- Labels, Titles, Linewidth, and Colours are added for each and every graph.
- 'grid on' is used to show grid in plots.
- 'saveas' is used to save graph figures in respective folders.
Results: screenshot of command window:
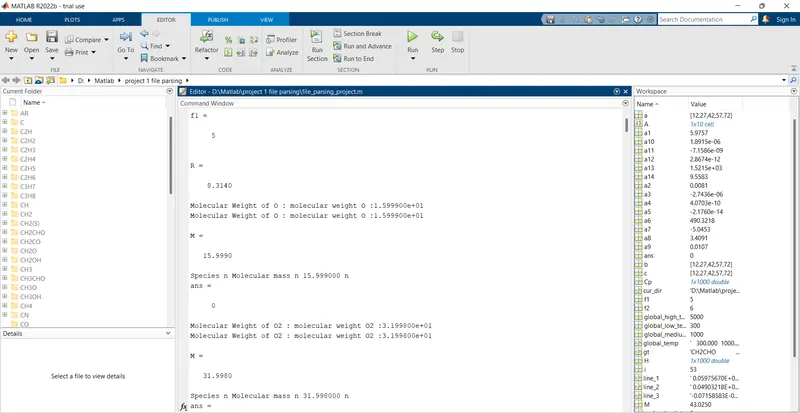
as shown above, the molecular weight for all the species are displayed in command window.
Molecular weight for all the species are as below:
- Molecular weight of O = 15.9990
- Molecular weight of O2 = 31.9980
- Molecular weight of H = 1.0080
- Molecular weight of H2 = 2.0160
- Molecular weight of OH = 17.0070
- Molecular weight of H2O = 18.0150
- Molecular weight of HO2 = 33.0060
- Molecular weight of H2O2 = 34.0140
- Molecular weight of C = 12.0010
- Molecular weight of CH = 13.0090
- Molecular weight of CH2 = 14.0170
- Molecular weight of CH2 (S) = 14.0170
- Molecular weight of CH3 = 15.0250
- Molecular weight of CH4 = 16.0330
- Molecular weight of CO = 28.0000
- Molecular weight of CO2 = 43.9990
- Molecular weight of HCO = 29.0080
- Molecular weight of CH2O = 30.0160
- Molecular weight of CH2OH = 31.0240
- Molecular weight of CH3O = 31.0240
- Molecular weight of CH3OH = 32.0320
- Molecular weight of C2H = 25.0100
- Molecular weight of C2H2 = 26.0180
- Molecular weight of C2H3 = 27.0260
- Molecular weight of C2H4 = 28.0340
- Molecular weight of C2H5 = 29.0420
- Molecular weight of C2H6 = 30.0500
- Molecular weight of CH2CO = 42.0170
- Molecular weight of HCCO = 41.0090
- Molecular weight of HCCOH = 42.0170
- Molecular weight of H2CN = 28.0240
- Molecular weight of HCN = 27.0160
- Molecular weight of HNO = 31.0140
- Molecular weight of N = 14.0070
- Molecular weight of NNH = 29.0220
- Molecular weight of N2O = 44.0130
- Molecular weight of NH = 15.0150
- Molecular weight of NH2 = 16.0230
- Molecular weight of NH3 = 17.0310
- Molecular weight of NO = 30.0060
- Molecular weight of NO2 = 46.0050
- Molecular weight of HCNO = 43.0150
- Molecular weight of HOCN = 43.0150
- Molecular weight of HNCO = 43.0150
- Molecular weight of NCO = 42.0070
- Molecular weight of CN = 26.0080
- Molecular weight of HCNN = 41.0230
- Molecular weight of N2 = 28.0140
- Molecular weight of AR = 39.9480
- Molecular weight of C3H8 = 44.0670
- Molecular weight of C3H7 = 43.0590
- Molecular weight of CH3CHO = 44.0330
- Molecular weight of CH2CHO = 43.0250
Attachments: screenshot of folder where all the files exists:

Plots:
Plots for O2:
1. Variation of Specific heat with the temperature of O2 :
2. Variation of Entropy with the temperature of O2 :
3. Variation of Enthalpy with the temperature of O2 :
Plots for N2:
1. Variation of Specific heat with the temperature of N2 :
2. Variation of Entropy with the temperature of N2 :
3. Variation of Enthalpy with the temperature of N2 :
Plots for CO2:
1. Variation of Specific heat with the temperature of CO2 :
2. Variation of Entropy with the temperature of CO2 :
3. Variation of Enthalpy with the temperature of CO2 :
Errors: Got some minor and spelling mistakes errors and cleared that.
Conclusion: The MATLAB program is written for parsing thermodynamic data, all the coefficients for temperature are extracted and The specific heat, enthalpy, and entropy for all the species are calculated and plotted against the local temperature range. The molecular weight is calculated for all the species.
References :
https://in.mathworks.com/matlabcentral/answers/17580-how-to-define-a-path-in-saveas-command
https://in.mathworks.com/help/matlab/ref/msgbox.html
https://in.mathworks.com/matlabcentral/answers/151692-display-value-in-message-box