Week 5 - Genetic Algorithm
Aim:
Write a code in MATLAB to optimise the stalagmite function and find the global.
Objective:
- To Understand the concept of genetic algorithm
- To Understand the syntax “ga” in MATLAB
- To find the Global Maxima of the stalagmite function in MATLAB
- Plot graphs for all 3 studies and for F maximum vs no. of iteration
-
Introduction:- Genetic Algorithm (GA) is a search-based optimization technique based on the principles of Genetics and Natural Selection. It is frequently used to find optimal or near-optimal solutions to difficult problems which otherwise would take a lifetime to solve. It is frequently used to solve optimization problems, in research, and in machine learning
Theory:-
Optimization:- Optimization is the process of making something better. In any process, we have a set of inputs and a set of outputs as shown in the following figure.
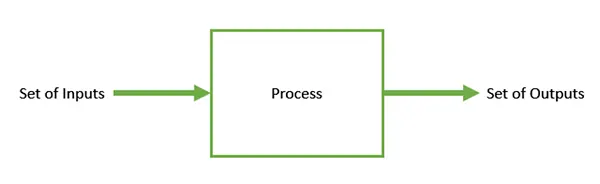
Optimization refers to finding the values of inputs in such a way that we get the “best” output values. The definition of “best” varies from problem to problem, but in mathematical terms, it refers to maximizing or minimizing one or more objective functions, by varying the input parameters.
The set of all possible solutions or values which the inputs can take make up the search space. In this search space, lies a point or a set of points which gives the optimal solution. The aim of optimization is to find that point or set of points in the search space.
Genetic Algorithm- Nature has always been a great source of inspiration to all mankind. Genetic Algorithms (GAs) are search based algorithms based on the concepts of natural selection and genetics. These are intelligent exploitation of random search provided with historical data to direct the search into the region of better performance in solution space. They are commonly used to generate high-quality solutions for optimization problems and search problems.
In GAs, we have a pool or a population of possible solutions to the given problem. These solutions then undergo recombination and mutation (like in natural genetics), producing new children, and the process is repeated over various generations. Each individual (or candidate solution) is assigned a fitness value (based on its objective function value) and the fitter individuals are given a higher chance to mate and yield more “fitter” individuals. This is in line with the Darwinian Theory of “Survival of the Fittest”.
In this way we keep “evolving” better individuals or solutions over generations, till we reach a stopping criterion.
Genetic Algorithms are sufficiently randomized in nature, but they perform much better than random local search (in which we just try various random solutions, keeping track of the best so far), as they exploit historical information as well.
The genetic algorithm uses three main types of rules at each step to create the next generation from the current population:
- Selection rulesselect the individuals, called parents, that contribute to the population at the next generation.
- Crossover rulescombine two parents to form children for the next generation.
- Mutation rulesapply random changes to individual parents to form children.
- 1.Initial population -The process begins with a set of individuals which is called a Population. Each individual is a solution to the problem you want to solve. An individual is characterized by a set of parameters (variables) known as Genes. Genes are joined into a string to form a Chromosome (solution)
-
2.Fitness fuction-
Fitness Function (also known as the Evaluation Function) evaluates how close a given solution is to the optimum solution of the desired problem. It determines how fit a solution is.
3.Selection-
The selectionj is based on the fitness score.The idea of selection phase is to select the fittest individuals and let them pass their genes to the next generation. Two pairs of individuals (parents) are selected based on their fitness scores. Individuals with high fitness have more chance to be selected for reproduction.
4.Crossover-
Crossover is the most significant phase in a genetic algorithm. For each pair of parents to be mated, a crossover point is chosen at random from within the genes. Offspring are created by exchanging the genes of parents among themselves until the crossover point is reached.
5. Mutation-
In certain new offspring formed, some of their genes can be subjected to a mutation with a low random probability. This implies that some of the bits in the bit string can be flipped.
Syntax for genetic algorithm-
CODEx = ga(fun,nvars)finds a local unconstrained minimum,x, to the objective function,fun.nvarsis the dimension (number of design variables) offun.x=ga(fun,nvars,A,b) finds a local minimum
xtofun, subject to the linear inequalitiesA*x≤b.gaevaluates the matrix productA*xas ifxis transposed (A*x').x=ga(fun,nvars,A,b,aeq,beq) finds a local minimum
xtofun, subject to the linear equalitiesAeq*x=beqandA*x≤b. (SetA=[]andb=[]if no linear inequalities exist.)gaevaluates the matrix productAeq*xas ifxis transposed (Aeq*x').x=ga(fun,nvars,A,b,aeq,beq,1b,ub)defines a set of lower and upper bounds on the design variables,
x, so that a solution is found in the rangelb≤x≤ub. (SetAeq=[]andbeq=[]if no linear equalities exist.)x=ga(fun,nvars,A,b,aeq,beq,1b,ub,nonlocon,option)subjects the minimization to the constraints defined innonlcon. The functionnonlconacceptsxand returns vectorsCandCeq, representing the nonlinear inequalities and equalities respectively.gaminimizes thefunsuch thatC(x)≤0andCeq(x) = 0. (Setlb=[]andub=[]if no bounds exist.)x=ga(fun,nvars,A,b,aeq,beq,1b,ub,nonlocon,option)minimizes with the default optimization parameters replaced by values in
options. (Setnonlcon=[]if no nonlinear constraints exist.) Createoptionsusing optimization.When there are integer constraints,
gadoes not accept linear or nonlinear equality constraints, only inequality constraints.x=ga(problem)finds the minimum for
problem, whereproblemis a structure.-
close all
clear all
clc
%input
x=linspace(0,0.6,150);
y=linspace(0,0.6,150);
num_spaces=50;

%forming 2d array
[xx,yy]=meshgrid(x,y);
for i=1:length(x)
    for j=1:length(y)
        input_vector(1)=xx(i,j);
        input_vector(2)=yy(i,j);
       f(i,j)=stalagmite(input_vector);
    end
end
%study 1-unbounded
tic
for i=1:num_spaces
    [results,fopt(i)]=ga(@stalagmite,2);
    xopt(i)=results(1);
    yopt(i)=results(2);
end
study_time1=toc
figure(1)
subplot(2,1,1)
surf(x,y,-f)
shading interp
hold on
plot3(xopt,yopt,-fopt,'marker','o')
subplot(2,1,2)
plot(-fopt)
xlabel('iteration')
ylabel('function maximum')


% study 2 bounded
tic
for i=1:num_spaces
    [results,fopt(i)]=ga(@stalagmite,2,[],[],[],[],[0;0],[0.6;0.6]);
    xopt(i)=results(1);
    yopt(i)=results(2);
end
study_time2=toc
figure(2)
subplot(2,1,1)
surf(x,y,-f)
shading interp
hold on
plot3(xopt,yopt,-fopt,'marker','o')
subplot(2,1,2)
plot(-fopt)
xlabel('iteration')
ylabel('function maximum')


% study 3 increase initial population
tic
options=optimoptions('ga')
options=optimoptions(options,'populationsize',250);
for i=1:num_spaces
    [results,fopt(i)]=ga(@stalagmite,2,[],[],[],[],[0;0],[0.6;0.6],[],[],options);
    xopt(i)=results(1);
    yopt(i)=results(2);
end
study_time3=toc
figure(3)
subplot(2,1,1)
surf(x,y,-f)
shading interp
hold on
plot3(xopt,yopt,-fopt,'marker','o')
subplot(2,1,2)
plot(-fopt)
xlabel('iteration')
ylabel('function maximum')


function A=stalagmite(input_vector)
x=input_vector(1);
y=input_vector(2);
f1=(sin(5.1*pi*x+0.5)).^6;
f2=exp((-4*log(2)*((x-0.0667).^2))/0.64);
f3=(sin(5.1*pi*y+0.5)).^6;
f4=exp((-4*log(2)*((y-0.0667).^2))/0.64);
A=-(f1*f2*f3*f4);
end
-
Program explanation-
close all
clear all
clc
%input
x=linspace(0,0.6,150);
y=linspace(0,0.6,150);
num_spaces=50;
- First we initialise the values of x and y taking 150 values between the interval 0 and 0.6
- We consider no of iterations num_spaces=50.
%forming 2d array[xx,yy]=meshgrid(x,y);
for i=1:length(x)
for j=1:length(y)
input_vector(1)=xx(i,j);
input_vector(2)=yy(i,j);
f(i,j)=stalaglmite(input_vector)
- to plot a 3D surface plot we take the 2d array of x and y using meshgrid command.
- store them in input_vector array.
- To be used as an argument to call the function stalagmite.
Function
function A = stalagmite(input_vector)
x=input_vector(1);
y=input_vector(2);
f1=(sin(5.1*pi*x+0.5)).^6;
f2=exp((-4*log(2)*((x-0.0667).^2))/0.64);
f3=(sin(5.1*pi*y+0.5)).^6;
f4=exp((-4*log(2))*((y-0.0667).^2)/0.64);
A =-(f1*f2*f3*f4);
end.
- create another fuction file for the stalagmite function.
- we take the ouput as -f since ga only minimises a given function.
- -f is considered it automatically gives us the maxima.
now let us make our first study-
we take no of iterations = num_spaces and we use the genetic algorithm function to caluclate the maxima of the function.
Here the ga is initiated with random population.
- In this case Here the ga is initiated with random population.
- this result store in the xopt, yopt.now we need to plot the surface of x,y,-f to get the 3D plot.
- plot the fopt functio so that we can visualise the optimum values at each iteration.
- To get the time taken to complete cycle we used the tic toc commands to record the time.
- put the labblingx axis is iteratuin & y axis is function max.
- specify the lower and upper bounds of x and y in this case,the ga is initiated with random population only.
-
store the results into xopt, yopt.now we need to plot the surface of x,y,-f to get the 3D plot.
-
use the plot3 command to make a plot of xopt,yopt and -fopt to plot the optimum maximas.
-
To get the time taken to complete cycle we used the tic toc commands to record the time.
-
put the labblingx axis is iteratuin & y axis is function max.
% study 3 increase initial population
- in this case let us increase our initial population which is default as 50 to 250.
- store the results into xopt, yopt.now we need to plot the surface of x,y,-f to get the 3D plot.
- plot3 command to make a plot of xopt,yopt and -fopt to plot the optimum maximas.
Output
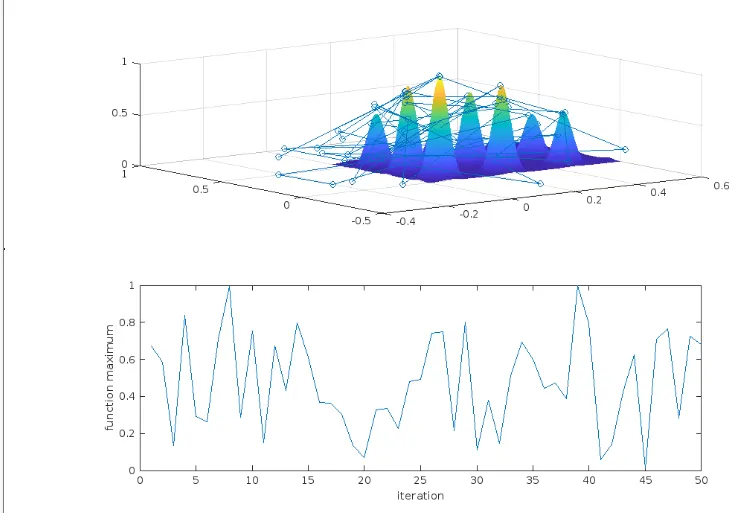
study 1-unbounded
Here we can see the optimal values went outside the values of x and y resulting in falling away from stagalmite surface.
So we failed to reach the global maxima in this case.
the study time = 4.6912s
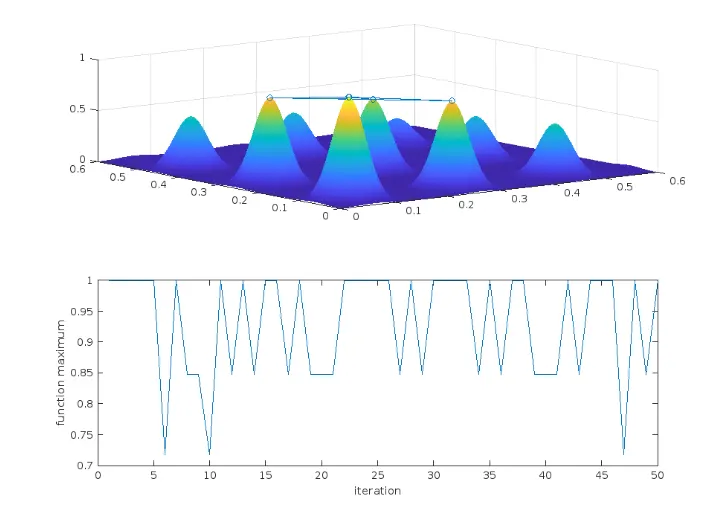
study 2 bounded
To get the time taken to complete cycle we used the tic toc commands to record the time.
If the study is executed the output is displayed as-
Study time2=5.1494s
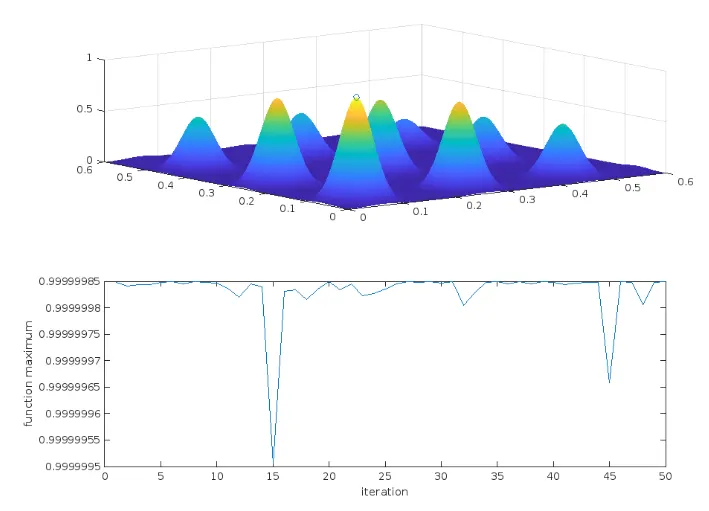 study 3 increase initial population
Study time3=19.1907s