Project 1 - Parsing NASA thermodynamic data
Aim:
To write a code in MATLAB to parse the NASA thermodynamic data file and calculate the thermodynamic properties of various gas species.
Objective:
- To write a function that extracts the 14 co-efficients and calculates the specific heat, enthalpy and entropy for all the species in the data file.
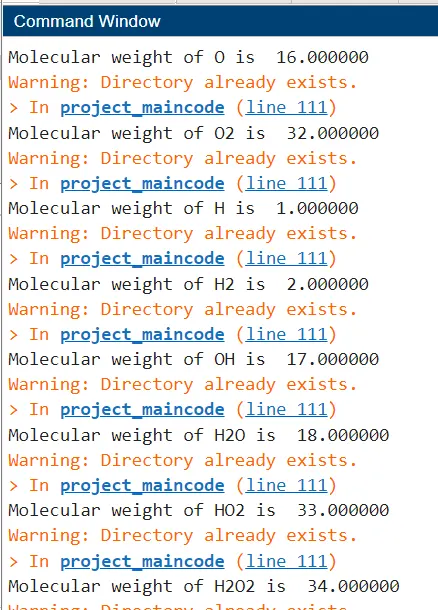
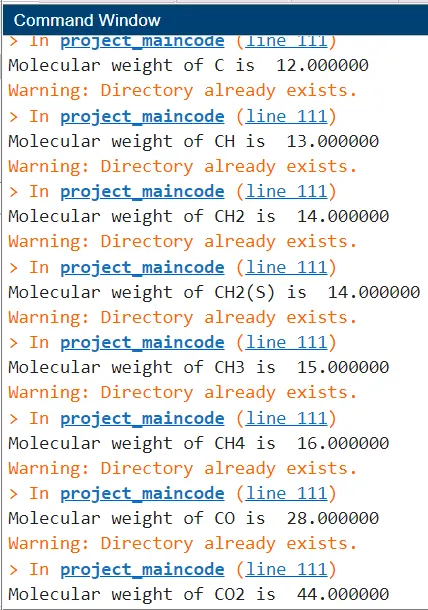
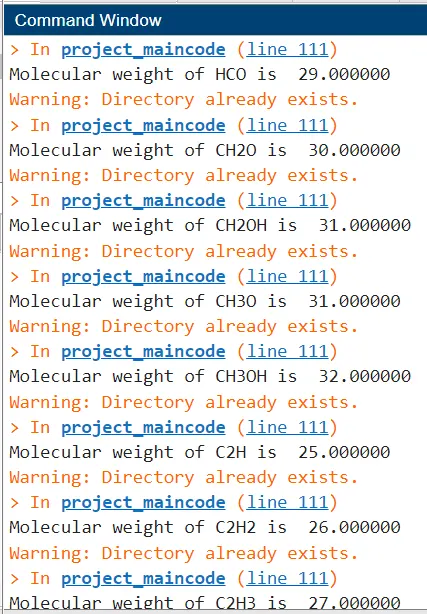
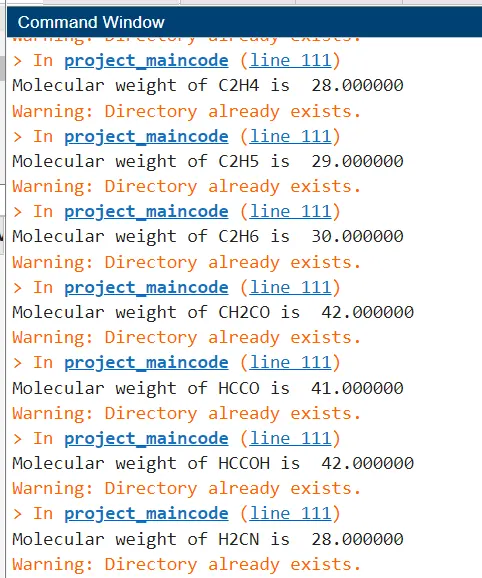
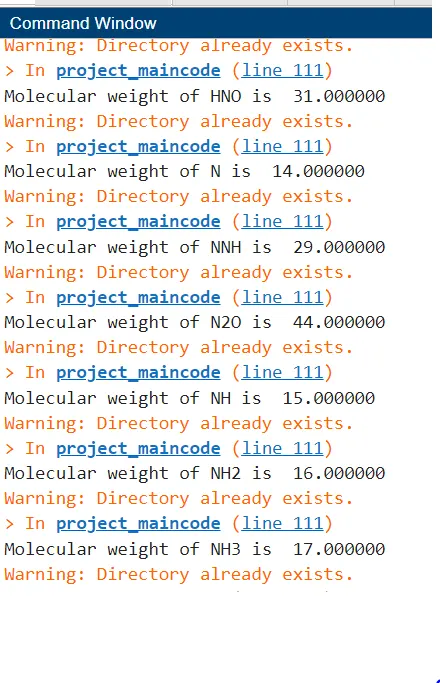
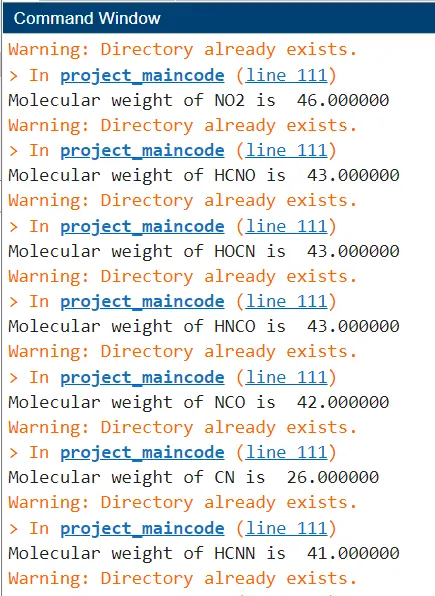
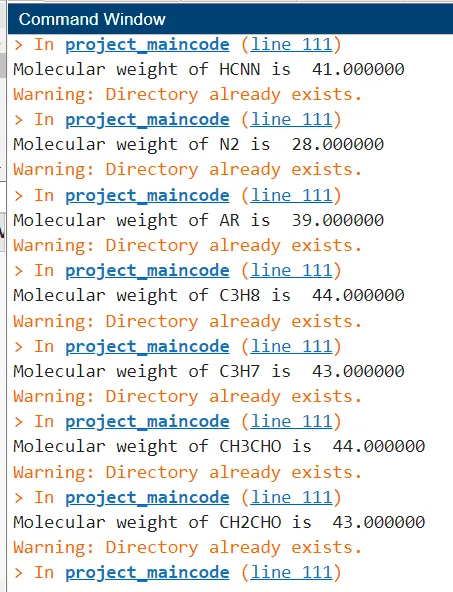
- A code to calculate the molecular weight of each species and display it in the command window.
- To plot Cp, Enthalpy and Entropy for the local temperature range (low temperature : high temperature) specific for each species.
- To save the plots as images with appropriate names and dump them in separate folders for each species with suitable name and all these should be done automatically.
- The main program will just take the 'THERMO.dat' file as input and generate Cp, H and S plots.
Theory:
File Parsing:
It is the method of splitting the file or other input into a piece of data that can be easily stored or manipulated. By doing this we are going to split a string into parts then recognizing the parts to convert it into something simpler than a string.
Here in this project we are going to split the NASA thermodynamic data which is having 53 gas species values in 213 lines. To perform the calculation for thermodynamic properties, we need some sort of co-efficient values and temperature ranges which is available in the NASA file. So, we are going to parse the values which are all needed for our calculation from that file.
Specific Heat:
Specific heat is the amount of heat energy required to raise the temperature of body per unit of mass. Specific heat is also known as specific heat capacity or mass specific heat. In SI units, specific heat is the amount of heat in joules required to raise 1 gram of a substance 1 Kelvin.
Enthalpy:
When a substance changes at constant pressure, enthalpy tells how much heat and work was added or removed from the substance. Enthalpy is similar to energy but not the same. When a substance grows or shrinks, energy is used up or released.
Entropy:
The entropy of an object is a measure of the amount of energy which is unavailable to do work. Entropy is also a measure of the number of possible arrangements of atoms a system can have. In this sense, entropy is the measure of uncertainty or randomness.
Gas Constant:
The gas constant is a physical constant denoted by R and is expressed in terms of units of energy per temperature increment per mole. The gas constant value is equivalent to Boltzmann constant but expressed as the pressure-volume product instead of nergy per increment of temperature per particle.
Molecular Weight:
Molecular weight is a measure of the sum of the atomic weight values of the atoms in a molecule. Molecular weight is used in chemistry to determine stoichiometry in chemical reactions and equations.
Governing Equations:
MATHEMATICAL EQUATION:
For specific heat
cp/R=a1+a2⋅T+a3⋅T2+a4⋅T3+a5⋅T4
For enthalpy
H/RT=a1+a2T/2+a3T2/3+a4⋅T3/4+a5⋅T4/5+a6/T
For entropy
SR=a1⋅log(T)+a2⋅T+a3⋅T2/2+a4⋅T3/3+a5⋅T4/4+a7
where
T=local temprature
a1-a7=high temperature coefficient
a8-a14=low temprature coefficient
R=Gas constant=8.314
steps for choosing the logic of code
Step 1: - We open the file and parse the file ,fopen is used to open a file.
Step 2: - To navigate throughout the file and using (fgetl) command to get the line of the file and read the file line by line to get to the desired result.
Step 3: - Reading the text from the header file and read the file line by line
Step 4: - String split command then cell array is generated. A cell array is a special data structure to store data of the different type and perform the desired task
Step 5: - The function for Cp, H, S is created to calculate them by taking the values from the file data
Step 6: - Molecular weight is calculated using the molecular weight function and is printed on the command window
Step 7: - The plots for Cp, H, S are created for each species and saved in a folder in jpg format to access the species with different images
Step 8: - Creating folders for different molecules and save the plots for specific heat, enthalpy, and entropy in that folder and display the molecular weight of different species in the command window
code for the function using in the main program-
CODE for the Entropy function-
function[S]=entropy(a1,a2,a3,a4,a5,a7,a8,a9,a10,a11,a12,a14,T,R,mid_temp)
if (T<=mid_temp)
    S=((a8.*logT)+(a9.*T)+((a10.*(T.^2))/2)+((a11.*(T.^3))/3)+(a12.*(T.^4))+a14)

else
    S=((a1.*log(T))+(a2.*T)+((a3.*(T.^2))/2)+((a4.*(T.^3))/3)+(a5.*(T.^4))+a7).*R

end-
Funtion for the entropy.
function [S]=entropy(a1,a2,a3,a4,a5,a7,a8,a9,a10,a11,a12,a14,T,R,mid_temp); -
function is used to make the code easy to implement.
-
Checking for the temperature -comments
-
The FIRST 7 coefficients are HIGH-temperature coefficients and the SECOND 7 coefficients are LOW-temperature coefficients
-
if(T<=mid_temp)comparing matrix values of the temperature generated from the linspace command with the global medium temperature
S=((a8.*logT)+(a9.*T)+((a10.*(T.^2))/2)+((a11.*(T.^3))/3)+(a12.*(T.^4))+a14)calculation of the entropy wrt to the equations -
else - else statement to perform the task if the if statements fail
-
S=((a1.*log(T))+(a2.*T)+((a3.*(T.^2))/2)+((a4.*(T.^3))/3)+(a5.*(T.^4))+a7).*R- calculation of the entropy wrt to the equations
-
end - to end or terminate the function
CODE for the Enthalpy function-
function[H]=enthalpy(a1,a2,a3,a4,a5,a6,a8,a9,a10,a11,a12,a13,T,R,mid_temp)
if(T<=mid_temp)
    H=((a8.*T+a9.*(T.^2/2)+a10.*(T.^3/3)+a11.*(T.^4/4)+a12.*(T.^5/5)+(a13)).*R);
else
    H=((a1.*T+a2.*(T.^2/2)+a3.*(T.^3/3)+a4.*(T.^4/4)+a5.*(T.^5/5)+(a6)).*R);
end-
Funtion for the enthalpy -
-
function [H] =enthalpy(a1,a2,a3,a4,a5,a6,a8,a9,a10,a11,a12,a13,T,R,mid_temp) function is used to make the code easy to implement.
-
Checking for the temperature -comments
-
The FIRST 7 coefficients are HIGH-temperature coefficients and the SECOND 7 coefficients are LOW-temperature coefficients.
-
if(T<=mid_temp)comparing matrix values of the temperature generated from the linspace command with the global medium temperature
-
H=((a8.*T+a9.*(T.^2/2)+a10.*(T.^3/3)+a11.*(T.^4/4)+a12.*(T.^5/5)+(a13)).*R);else - else statement to perform the task if the if statements failH=((a1.*T+a2.*(T.^2/2)+a3.*(T.^3/3)+a4.*(T.^4/4)+a5.*(T.^5/5)+(a6)).*R);end
CODE for the specific heat function-
function[Cp]=specific_heat(a1,a2,a3,a4,a5,a8,a9,a10,a11,a12,T,R,mid_temp)
if(T<=mid_temp)
    Cp=((a8+(a9.*T)+(a10.*T.^2)+(a11.*T.^3)+(a12.*T.^4)).*R);
else
    Cp=(a1+(a2.*T)+(a3.*T.^2)+(a4.*T.^3)+(a5.*T.^4))*R;
end-
Funtion for the specific heat
-
function [Cp] =specific_heat(a1,a2,a3,a4,a5,a8,a9,a10,a11,a12,a13,T,R,mid_temp) function is used to make the code easy to implement.
-
Checking for the temperature -comments
-
The FIRST 7 coefficients are HIGH-temperature coefficients and the SECOND 7 coefficients are LOW-temperature coefficients.
-
if(T<=mid_temp)comparing matrix values of the temperature generated from the linspace command with the global medium temperature
-
Cp=((a8+(a9.*T)+(a10.*T.^2)+(a11.*T.^3)+(a12.*T.^4)).*R);else - else statement to perform the task if the if statements failCp=(a1+(a2.*T)+(a3.*T.^2)+(a4.*T.^3)+(a5.*T.^4))*R;end
CODE for the molecular weight function-
function[M_W]=molecular_weight(species_name)
elements=['H','C','O','N','A'];
atomic_weight=[1 12 16 14 39];
M_W=0;
for i = 1:length(species_name)
    for j=1:length(elements)
if strcmp(species_name(i),elements(j))
    M_W=M_W+atomic_weight(j);
    A=j;
end
    end
    n=str2num(species_name(i));
    if(n>1)
        M_W=M_W+(atomic_weight(A)*(n-1));

    end
end
endMain code of the NASA file pairsing and plot generation-
clear all
 close all
 clc

% header block
% R is the universal gas constant
R=8.314;

% load the 'thermo.data' file
f1 = fopen('THERMO.dat','r');
first_line = fgetl(f1);
second_line=fgetl(f1);

% obtaining global max, min  and medium temperatures
A=strsplit(second_line,' ');
 % array generated
global_min_temp=str2num(A{2});
global_mid_temp=str2num(A{3});
global_max_temp=str2num(A{4});

%temp range
temperature=linspace(global_min_temp,global_max_temp,100);
%skipping the three comments
for j=1:3
     k=fgetl(f1);
end

% species block
% running for loop for 53 times
for i=1:53
%pairsing of the species block
tline=fgetl(f1);
S=strsplit(tline,' ');

species_name=S{1}; % monoxygen

%loc0al temp
low_temp=str2num(S{end-3});
high_temp=str2num(S{end-2});
mid_temp=str2num(S{end-1});

T=linspace(low_temp,high_temp,100);

%extracting the coefficient
tline_1=fgetl(f1);

a=findstr(tline_1,'E');
% finding the 5 coefficient from 1 line
      a1=tline_1(1:a(1)+3);
      a1=str2num(a1);

      a2=tline_1(a(1)+4:a(2)+3);
      a2=str2num(a2);

     a3=tline_1(a(2)+4:a(3)+3);
     a3=str2num(a3);

     a4=tline_1(a(3)+4:a(4)+3);
     a4=str2num(a4);

     a5=tline_1(a(4)+4:a(5)+4);
     a5=str2num(a5);

%     % line 3 5coefficient
      tline_2=fgetl(f1);
      a=findstr(tline_2,'E');


     a6=tline_2(1:a(1)+3);
     a6=str2num(a6);

     a7=tline_2(a(1)+4:a(2)+3);
     a7=str2num(a7);

     a8=tline_2(a(2)+4:a(3)+3);
     a8=str2num(a8);

     a9=tline_2(a(3)+4:a(4)+3);
     a9=str2num(a9);

     a10=tline_2(a(4)+4:a(5)+3);
     a10=str2num(a10);

% %line4 4coefficient
   tline_3=fgetl(f1);
   a=findstr(tline_3,'E');

    a11=tline_3(1:a(1)+3);
    a11=str2num(a11);

    a12=tline_3(a(1)+4:a(2)+3);
    a12=str2num(a12);

    a13=tline_3(a(2)+4:a(3)+3);
    a13=str2num(a13);

    a14=tline_3(a(3)+4:a(4)+3);
    a14=str2num(a14);
    % find out the 'specific heat,enthalpy,entropy' using the function code.
    [cp]=specific_heat(a1,a2,a3,a4,a5,a8,a9,a10,a11,a12,T,R,mid_temp);
    [H]=enthalpy(a1,a2,a3,a4,a5,a6,a8,a9,a10,a11,a12,a13,T,R,mid_temp);
    [S]=entropy(a1,a2,a3,a4,a5,a7,a8,a9,a10,a11,a12,a14,T,R,mid_temp);

    % calculate the molecular wt. of each species
   [M_W]=molecular_weight(species_name);
   k=sprintf('Molecular weight of %s is  %f',species_name,M_W);
   disp(k)

  % plotting
  % create folder
  mkdir(species_name);
  cd(species_name);
%plotting the graph for Cp vs temp
 figure(1)
 plot(T,cp,'LineWidth',2,'Color','r')
 xlabel(' local temperature [k]');
 ylabel('specific heat [J/Kg-kl]')
 grid on
 title('local temprature vs cp')
 saveas(figure(1),'specific heat.jpg');

 %plotting the graph for enthalpy vs temp
 figure(2)
 plot(T,H,'LineWidth',2,'Color','b')
 xlabel(' local temperature [k]');
 ylabel('enthalpy[J/Kg-kl]')
 grid on
 title('local temprature vs Enthalpy')
 saveas(figure(2),'Enthalpy.jpg');


%plotting the graph for entropy vs temp
figure(3)
plot(T,S,'LineWidth',2,'Color','g')
xlabel(' local temperature [k]');
ylabel('entropy[J/K]')
grid on
 title('local temprature vs Entropy')
 saveas(figure(3),'Entropy.jpg');
cd ..

end
- %File paising for a file
- clear all-to clear all the work space
- close all-to close all the inpute window
- clc-to clear the command window
- R is the universal gas constant
- f1 = fopen('THERMO.dat','r');-to open a file in read mode.
- first_line = fgetl(f1);-to read the file line by line.
- A=strsplit(second_line,' ');- to spilt the line saved in the temp.variable when space found.
- global_min_temp=str2num(A{2});-assining the global lower temp.
- global_mid_temp=str2num(A{3});-assining the global lmiddle temp
- global_max_temp=str2num(A{4});-assining the global higher temp
- temperature=linspace(global_min_temp,global_max_temp,100);-to generate the 100 values between range of the temperature.
- for j=1:3-for skipping the line by running loops
- k=fgetl(f1);-to read the line
- end-end of the loop
- for i=1:53-% running for loop for 53 times
- tline=fgetl(f1);-reading the first line
- S=strsplit(tline,' ');-splting the string when the space is found.
- species_name=S{1}; % monoxygen (name of the molecular)
- low_temp=str2num(S{end-3});
- high_temp=str2num(S{end-2});
- mid_temp=str2num(S{end-1});
- T=linspace(low_temp,high_temp,100);
- tline_1=fgetl(f1);-reading the 1st line of the coefficent
- a=findstr(tline_1,'E');-finding the string using the command
- [cp]=specific_heat(a1,a2,a3,a4,a5,a8,a9,a10,a11,a12,T,R,mid_temp);-Cp calculaton by using finction
- [H]=enthalpy(a1,a2,a3,a4,a5,a6,a8,a9,a10,a11,a12,a13,T,R,mid_temp);- enthalpy calculaton by using finction
- [S]=entropy(a1,a2,a3,a4,a5,a7,a8,a9,a10,a11,a12,a14,T,R,mid_temp);-entropy calculaton by using finction
- [M_W]=molecular_weight(species_name); -calculate the molecular weight by using function
- k=sprintf('Molecular weight of %s' %f,species_name,M_W);-reading &witing the molecular weight
- disp(k)
- mkdir(species_name);-for making new directory
- cd(species_name);-changing the directory
- cd .. - to change the directory
- end- end of the for loop
Output
For the saving of the folder for the species
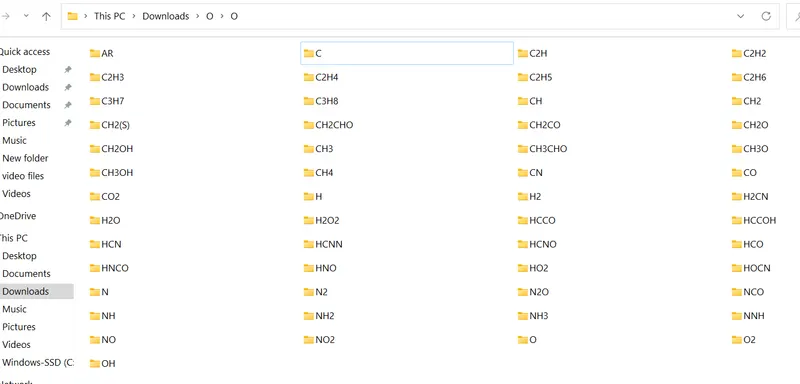
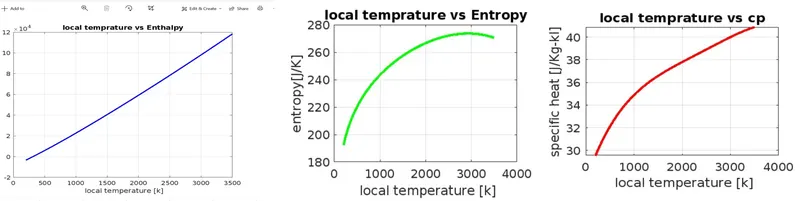
Output for the plot of N2,O2,&CO2 for the enthalpy,entropy & specific heat-
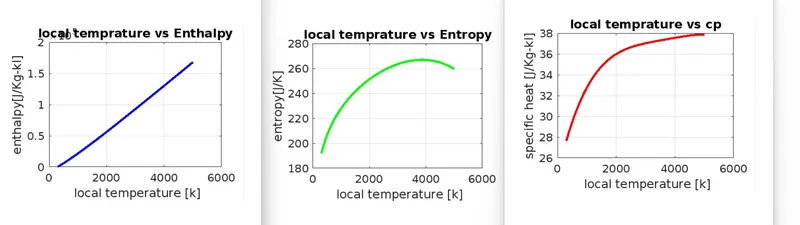
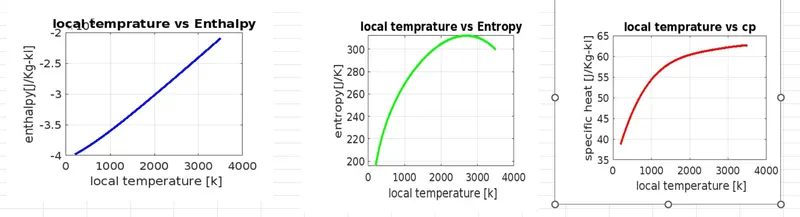
Blue colur plot -variation in enthalpy wrt temp.
Red colur plot -variation in specific heat wrt temp.
Green colur plot -variation in entropy wrt temp.
1)plot for O2
2)plot for N2
3)Plot for CO2
Output for molecular weight of the molecule-
Error face during the development of the code-
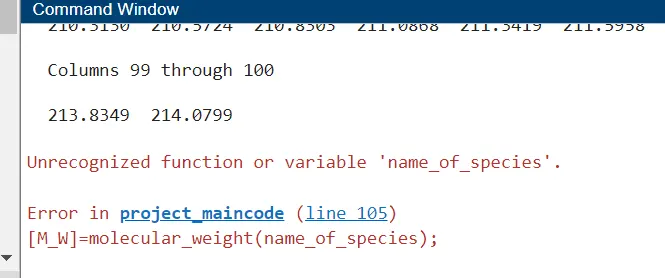
1)incorrect sign eual to due to that error is showing in command window.

2)On line number 105 in which used name_of_species insted of the species_name
Conclusion-
1.Pairsing of the file was done.
2. To plot for 53 molecular was generated.
3.All three plots (cp,h,s) were saved in a folder for a molecules.
4.Molecular weight is generated in command window
Drive link-
https://drive.google.com/file/d/1fxPsX_rLkKhuyROS_BnlXh0KxCWjAU0H/view?usp=sharing