Challenge

Week 5 - Genetic Algorithm

Aim

To Write a code in MATLAB to optimise the stalagmite function and find the global maxima of the function.

Before writing the code to fing global maxima of Genetic algorithm we have to understand the GA and global maxima nad mina functions

Genetic Algorithm

The genetic algorithm is a method for solving both constrained and unconstrained optimization problems that is based on natural selection, the process that drives biological evolution. The genetic algorithm repeatedly modifies a population of individual solutions. At each step, the genetic algorithm selects individuals from the current population to be parents and uses them to produce the children for the next generation.

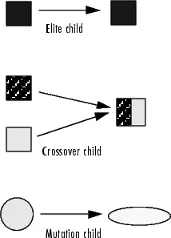
with this chart we can understand what the GA is the function to calculate the mutation of generations with codes in matlab tool

the ga has three rules

1) Elite childrens

Selection rules select the individuals, called parents, that contribute to the population at the next generation. The selection is generally stochastic, and can depend on the individuals' scores

it is a function which used by selecting the random induviduals as a function to find the population of the next generation of pure induviduals without changes in chromosome or genes of the induviduals

2) cross-over

the cross-over is the method which a individual from different generation are combined to produce the next generations while this method the chromosome and genes of two different are combined and produce a different generation

For problems with linear constraints, the default crossover function creates the child as a random weighted average of the parents.

3)Mutation

The mutation in generations can be occur in in the changes of chromosome or gene changes from the previous generation parents can make some changes in the present generation compare to the previous

The algorithm creates mutation children by randomly changing the genes of individual parents. By default, for unconstrained problems the algorithm adds a random vector from a Gaussian distribution to the parent. For bounded or linearly constrained problems, the child remains feasible.
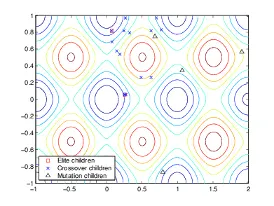
The following figure shows the children of the initial population, that is, the population at the second generation, and indicates whether they are elite, crossover, or mutation children.
Global maxima and minima

Programs to find the GA in three different cases

Before that we have to evaluate the stalgamite function which based on the equation given in the video

clear all
close all
clc
%Defening search space
x = linspace(0,0.6,150);
y = linspace(0,0.6,150);
numcases = 50
%creating 2D mesh
[xx,yy] = meshgrid(x,y);
%evaluating stalgamate function
for i = 1:length(xx)
for j= 1:length (yy)
input_vector(1)=xx(i,j);
input_vector(2)=yy(i,j);
f(i,j) = stalagmite(input_vector);
end
end
Explanation
in this program we are evaluatng the function code which created using the equation for the stalgamite function for the Genetic algorithm
Stalgamite function
function [f] = stalagmite(input_vector)
x = input_vector(1);
y = input_vector(2);
f1x = (sin(5.1*pi*input_vector(1)+0.5)).^6
f1y = (sin(5.1*pi*input_vector(2)+0.5)).^6
f2x = exp(-4*log(2)*((x - 0.0667).^2))/(0.64);
f2y = exp(-4*log(2)*((y - 0.0667).^2))/(0.64);
f = -(f1x*f2x*f1y*f2y)
end

Now we can able to find the varitions occur in three different cases with same outputs for the 3 cases even

1) Study 1

tic
%study1 - Unbounded statistical behaviour
for a = 1:numcases
[inputs,fopt(a)] = ga(@stalagmite,2);
xopt(a) = inputs(1);
yopt(a) = inputs(2);
end
study1_time = toc
figure(1)
subplot(2,1,1)
hold on
surfc(xx, yy, -f)
shading interp
plot3(xopt,yopt,-fopt,'marker','o','markersize',3,'markerfacecolor','k')
title('unbounded')
subplot(2,1,2)
plot(fopt)
xlabel('iterations')
ylabel('function maxima')

Explanation

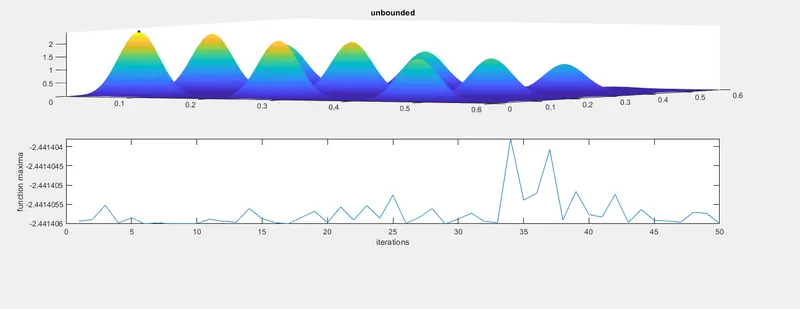
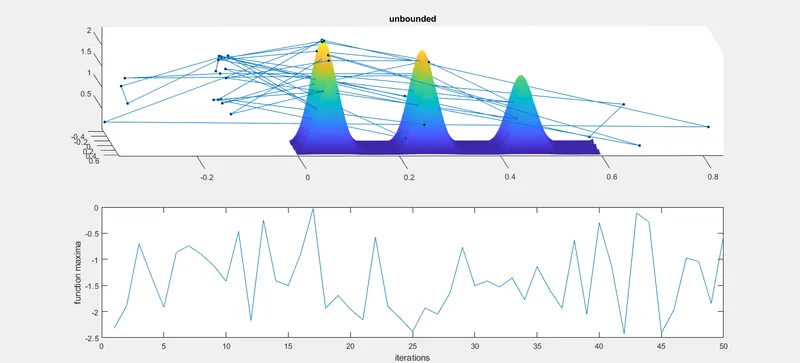
In this first study we are going to find the plots of unbounded statistical behaviour

for this function the input of [inputs,fopt(a)] = ga(@stalagmite,2); are run against the number of cases which is given a 50 and the optimum values of inputs are also find using for loops

After that with using of plot commands we use plot 3 command gives the 3D graph for the global maxima of the study against the total number of time which the program run with numcases

the anothe subplot is used to understand the optimum values of f and number of ga iteration run in the function

2)Study 2

%Study2 with upperbound and lower bound
tic
for b= 1:numcases
[inputs, fopt(b)] = ga(@stalagmite,2,[],[],[],[],[0;0],[0.6;0.6]);
xopt(b) = inputs(1);
yopt(b) = inputs(2);
end
study2_time = toc
figure(2)
subplot(2,1,1)
hold on
surfc(xx, yy, -f)
shading interp
plot3(xopt,yopt,-fopt,'marker','o','markersize',3,'markerfacecolor','k')
title('unbounded')
subplot(2,1,2)
plot(fopt)
xlabel('iterations')
ylabel('function maxima')
Explanation
While the study 2 is slightly differ from the previous study that this time we are changing the ga command with x = ga(fun,nvars,A,b,Aeq,beq)
while the x = ga is used to finds a local minimum x to fun, subject to the linear equalities Aeq*x = beq and A*x ≤ b. (Set A=[] and b=[] if no linear inequalities exist
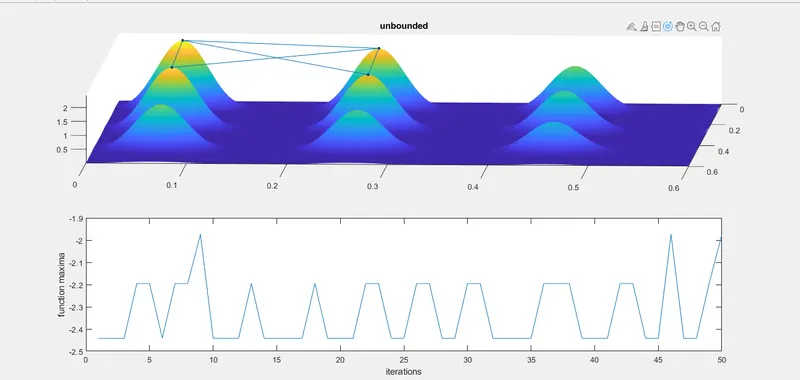
with theses equation we can find the upper and lower bounds of the function to get the output graph clearly from previous graph
3)Study3
%study3 Increasing population
options = optimoptions('ga')
options = optimoptions(options,'PopulationSize',600);
tic
for c= 1:numcases
[inputs, fopt(c)] = ga(@stalagmite,2,[],[],[],[],[0;0],[0.2;0.2]);
xopt(c) = inputs(1);
yopt(c) = inputs(2);
end
study3_time = toc
figure(3)
subplot(3,1,1)
hold on
surfc(xx, yy, -f)
shading interp
plot3(xopt,yopt,-fopt,'marker','o','markersize',3,'markerfacecolor','k')
title('unbounded')
subplot(3,1,2)
plot(fopt)
xlabel('iterations')
ylabel('function maxima')
Explanation
From the previous two studies the only differ for this study after the fitting function is calculated , we have a command called “optimoptions()”, the syntax for this command is
options = optimoptions('ga')
options = optimoptions(options,'PopulationSize',600); are set to get the ploted figures of better global maxima and iteration values of the function
Screenshots of the output
Study_1
Study_2
Study_3
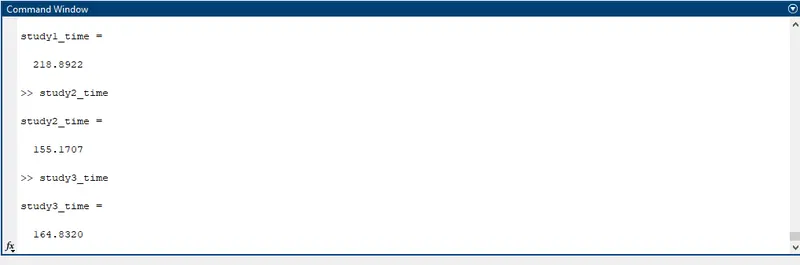
Time taken for the function to plot the outputs
Errors faced while programing
While callling the stalagmite function i given as A and output as f so i got the error which is
Output argument "A" (and possibly others) not assigned a value in the execution with "stalagmite" function.
Ive resolved it by changing the Input function name
and i've got errors while calling the inputs due to some typos and resolved
External links to understaind GA and global maxima
https://youtu.be/PJe3adPrcfA
Your portfolio, next

Ship work like this
in your own course.

Talk to a career counsellor

Free 20-minute call. We'll map the right course to where you want to work.

By submitting you agree to our Terms and Privacy Policy.