Week 5 - Genetic Algorithm
Outline of the Algorithm
The following outline summarizes how the genetic algorithm works:
-
The algorithm begins by creating a random initial population.
-
The algorithm then creates a sequence of new populations. At each step, the algorithm uses the individuals in the current generation to create the next population. To create the new population, the algorithm performs the following steps:
-
Scores each member of the current population by computing its fitness value. These values are called the raw fitness scores.
-
Scales the raw fitness scores to convert them into a more usable range of values. These scaled values are called expectation values.
-
Selects members, called parents, based on their expectation.
-
Some of the individuals in the current population that have lower fitness are chosen as elite. These elite individuals are passed to the next population.
-
Produces children from the parents. Children are produced either by making random changes to a single parent—mutation—or by combining the vector entries of a pair of parents—crossover.
-
Replaces the current population with the children to form the next generation.
-
-
The algorithm stops when one of the stopping criteria is met. See Stopping Conditions for the Algorithm.
-
The algorithm takes modified steps for linear and integer constraints. See Integer and Linear Constraints.
-
The algorithm is further modified for nonlinear constraints. See Nonlinear Constraint Solver Algorithms for Genetic Algorithm.
Stalagmite function is a mathematical model which helps to generate local minima and maxima. It is a three dimensional function and the way the function is designed is that it has a lot of local maxima or minima and one global maxima or minima. The name stalagmite is actually a type of rock formation that arises from the floor of a cave due to the accumulation of material deposited on the floor from ceiling drippings.
- x = ga(fun,nvars) finds a local unconstrained minimum, x, to the objective function, fun. nvars is the dimension (number of design variables) of fun.
- x = ga(fun,nvars,A,b) finds a local minimum x to fun, subject to the linear inequalities A*x ≤ b. ga evaluates the matrix product A*x as if x is transposed (A*x').
- x = ga(fun,nvars,A,b,Aeq,beq) finds a local minimum x to fun, subject to the linear equalities Aeq*x = beq and A*x ≤ b. (Set A=[] and b=[] if no linear inequalities exist.) ga evaluates the matrix product Aeq*x as if x is transposed (Aeq*x').
- x = ga(fun,nvars,A,b,Aeq,beq,lb,ub) defines a set of lower and upper bounds on the design variables, x, so that a solution is found in the range lb ≤ x ≤ ub. (Set Aeq=[] and beq=[] if no linear equalities exist.)
- x = ga(fun,nvars,A,b,Aeq,beq,lb,ub,nonlcon) subjects the minimization to the constraints defined in nonlcon. The function nonlcon accepts x and returns vectors C and Ceq, representing the nonlinear inequalities and equalities respectively. ga minimizes the fun such that C(x) ≤ 0 and Ceq(x) = 0. (Set lb=[] and ub=[] if no bounds exist.)
- x = ga(fun,nvars,A,b,Aeq,beq,lb,ub,nonlcon,options) minimizes with the default optimization parameters replaced by values in options. (Set nonlcon=[] if no nonlinear constraints exist.) Create options using optimoptions.
- x = ga(fun,nvars,A,b,Aeq,beq,lb,ub,nonlcon,intcon) or x = ga(fun,nvars,A,b,Aeq,beq,lb,ub,nonlcon,intcon,options) requires that the variables listed in intcon take integer values.
- x = ga(problem) finds the minimum for problem, a structure described in problem.
- [x,fval] = ga(___), for any previous input arguments, also returns fval, the value of the fitness function at x.
- [x,fval,exitflag,output] = ga(___) also returns exitflag, an integer identifying the reason the algorithm terminated, and output, a structure that contains output from each generation and other information about the performance of the algorithm.
- [x,fval,exitflag,output,population,scores] = ga(___) also returns a matrix population, whose rows are the final population, and a vector scores, the scores of the final population.
- To begin creating the stalagmite function, we must first construct a separate function describing the stalagmite function. The function's negative sign will flip the stalagmite plot, resulting in the function maximum.
%Define Stalagmite Function

function [f] = stalagmite(input_vector)
x = input_vector(1);
y = input_vector(2);
f1 = (sin((5.1*pi*x)+0.5))^6;
f2 = (sin((5.1*pi*y)+0.5))^6;
f3 = exp(-4*log(2)*((x-0.0667)^2)/0.64);
f4 = exp(-4*log(2)*((y-0.0667)^2)/0.64);
f = -(f1*f2*f3*f4);
end
Line 1 ,2 & 3 - clear the variable in the workspace, close all plots and figures and clear the command window.
Line 4 to 8 - the ‘x’ array and ‘y’ array is defined using ‘linspace’ command to create values at 150 equal intervals.
A 2D mesh of x and y array is created by using ‘meshgrid’ command and the number of iterations or cases that the code should perform is defined. This is given by num_cases = 50.
Line 10 to 16 - To evaluate the stalagmite function, ‘for’ loop is used where ‘i’ is initialized and for every value of ‘i’ another ‘for’ loop is used to initialize ‘j’. The input vector values of ‘xx’ and ‘yy’ are defined and the stalagmite function for these input vector is defined.
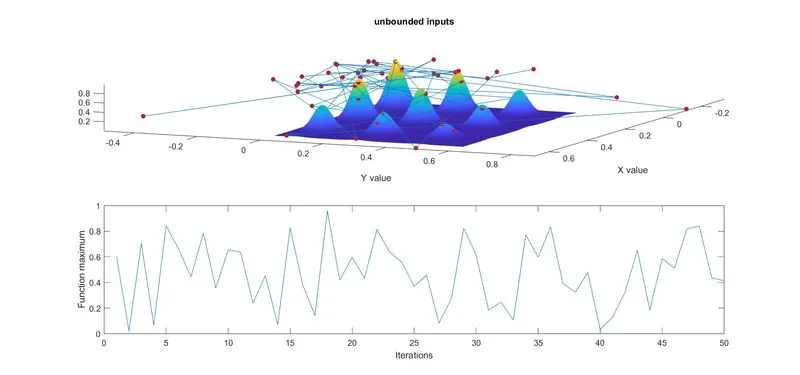
Line 17 to 37 - the maximum value of function is found out with no restrictions, no bounds and no limits.This is done using ‘for’ loop where we use ‘ga’ syntax to give values for inputs and optimum max value. The stalagmite function is called in ‘ga’ syntax and number of variables ‘nvars’ are 2. To know the time that is taken to solve the loop for 50 iterations, ‘tic’ and ‘toc’ command is used before and after the loop respectively. Then the function created in the loop is plotted by using ‘surfc’ command for ‘xx, yy and function output’. To neglect the gridlines on the surface and obtain a smooth and clean plot, ‘shading interp’ command is used. The ‘subplot(2,1,1)’ is used to plot multiple plots on same figure which also divides figure in grid of 2x1 and axes to be placed at 1.The ‘plot3’ command plots the 3D points at ‘xopt, yopt and optimum value of function’ with ‘o’ shaped and red colour. The labels and title are then provided. Now in the same figure, the values of optimum function ‘fopt’ are plotted for 50 iterations.
Line 39 to 60 - the remaining step as above are same except the only difference is in the ‘ga’ syntax. This time the algorithm is provided lower limits and upper limits as [0;0] and [1;1] respectively.
Line 62 to 86 - the number of iterations are increased to 300. So for this study, the syntax, “options = optimoptions(‘SolverName’,’Name’,‘Value’)” is used which returns with named parameter ‘Populations’ with the altered values ‘260’.
clear
close all
clc
x = linspace(0,0.6,150);
y = linspace(0,0.6,150);
num_cases = 50;

[xx, yy] = meshgrid(x,y);

for i = 1:length(xx)
   for j = 1:length(yy)
    input_vector(1) = xx(i,j);
    input_vector(2) = yy(i,j);
    F(i,j) = stalagmite(input_vector);
   end
end
%study 1 Statistical behaviour with unbound inputs
tic
for i = 1:num_cases
    [inputs1,Fopt1(i)] = ga(@stalagmite,2);
    xopt1(i) = inputs1(1);
    yopt1(i) = inputs1(2);
end
study1_timer=toc;
figure(1)
subplot(2,1,1);
hold on
surfc(xx,yy,-F);
shading interp;
xlabel('X value');
ylabel('Y value');
plot3(xopt1,yopt1,-Fopt1,'marker','o','markersize',5,'markerfacecolor','r');
title('unbounded inputs');
subplot(2,1,2);
plot(-Fopt1);
xlabel('Iterations');
ylabel('Function maximum');

%study 2 Statistical behaviour with upper and lower bonds
tic
for i = 1:num_cases
    [inputs2,Fopt2(i)] = ga(@stalagmite,2,[],[],[],[],[0;0],[1;1]);
    xopt2(i) = inputs2(1);
    yopt2(i) = inputs2(2);
end
study_time_2 = toc;

figure(2)
subplot(2,1,1)
hold on
surfc(xx,yy,-F)
shading interp;
plot3(xopt2,yopt2,-Fopt2,'marker','o','markersize',5,'markerfacecolor','r');
xlabel('X value')
ylabel('Y value')
title('Statistical behaviour wih upper and lower bonds')
subplot(2,1,2)
plot(-Fopt2)
xlabel('Iterations')
ylabel('Function maximum')

%Study 3 Statistical behaviour with increase population and with upper and lower bonds
tic
options = optimoptions('ga');
options = optimoptions(options,'Populationsize',260);

for  i = 1:num_cases
    [inputs3,Fopt3(i)] = ga(@stalagmite,2,[],[],[],[],[0;0],[1;1],[],[],options);
    xopt3(i)=inputs3(1);
    yopt3(i)=inputs3(2);
end
Study_time_3 = toc;

figure(3)
subplot(2,1,1)
hold on
surfc(xx,yy,-F)
shading interp;
plot3(xopt3,yopt3,-Fopt3,'marker','o','markersize',5,'markerfacecolor','r')
xlabel('X value')
ylabel('Y value')
title( 'Statistical behaviour with increased population and with upper amd lower bonds')
subplot(2,1,2)
plot(-Fopt3)
xlabel('Iterations')
ylabel('Function maximum')
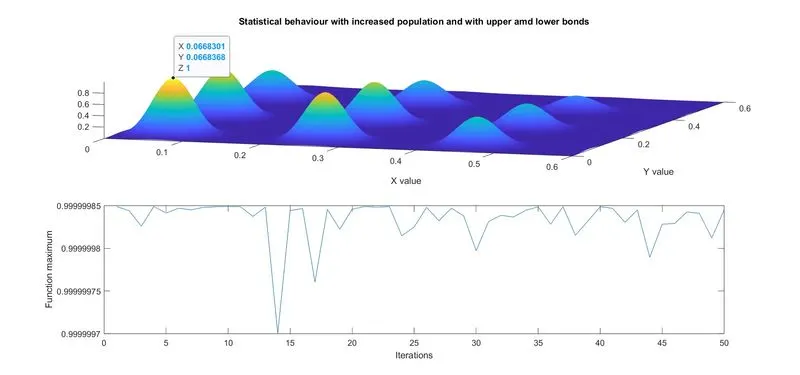
Thus the global maxima, we have got is
x= 0.0668301
y= 0.0668368
* No error faced during programming
References: