Project 1 - Parsing NASA thermodynamic data
Main Program
%Program for Parsing NASA's Thermodynamics Data file
clear
close all
clc

%Defining input for universal gas constant
R = 8.314; % J/mol K

%Opening the thermo.dat file for reading data
 f1 = fopen('THERMO.dat','r');
 l1 = fgetl(f1);                  %using fgetl cmd to ignore line
 l2 = fgetl(f1);                  %using fgetl cmd to store the temp data
 t = strsplit(l2);            %separating the string by splitting it into 3
 global_min = str2double(t{2});  %assigining the values of min,mid and
 global_mid = str2double(t{3});  %max temp after converting from string
 global_max = str2double(t{4});  % to numbers

 temp = linspace(global_min,global_max,400); %dividing the temp in 400parts

 % we can skip the next 3 header lines by using fgetl in for loop
 for i = 1:3
     fgetl(f1);
 end

 for i= 1:53
     %first reading the line with info of species
     line_1 = fgetl(f1);
     A = strsplit(line_1, ' ');
     Species_name = (A{1});
      % now extracting the 14 High and low temperature coefficients
     tline_2 = fgetl(f1);
     tline_3 = fgetl(f1);
     tline_4 = fgetl(f1);
     %finding the location of E to extract the coefficient as string
     a = strfind(tline_2,'E');
     b = strfind(tline_3,'E');
     c = strfind(tline_4,'E');

     %extraction of 7 high temperature coefficients a1,a2,a3,a4,a5,a6,a7
     a1 = str2double(tline_2(1:a(1)+3));
     a2 = str2double(tline_2(a(1)+4:a(2)+3));
     a3 = str2double(tline_2(a(2)+4:a(3)+3));     %extracting coeff by
     a4 = str2double(tline_2(a(3)+4:a(4)+3));     %converting into number
     a5 = str2double(tline_2(a(4)+4:a(5)+3));     %using str2double
     a6 = str2double(tline_3(1:b(1)+3));
     a7 = str2double(tline_3(b(1)+4: b(2)+3));

     %extraction of 7 low temperature coefficients b1,b2,b3,b4,b5,b6,b7
     b1 = str2double(tline_3(b(2)+4: b(3)+3));
     b2 = str2double(tline_3(b(3)+4: b(4)+3));
     b3 = str2double(tline_3(b(4)+4: b(5)+3));
     b4 = str2double(tline_4(1:c(1)+3));
     b5 = str2double(tline_4(c(1)+4: c(2)+3));
     b6 = str2double(tline_4(c(2)+4: c(3)+3));
     b7 = str2double(tline_4(c(3)+4: c(4)+3));


 % Making new subfolder species to save the plots of individual species
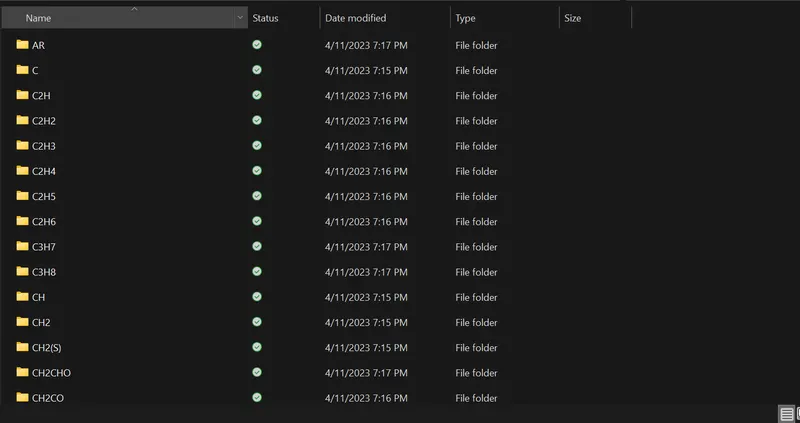
 mkdir(['C:\Users\u411715\OneDrive - Danfoss\Documents\SKILLLYNC\Parsing_New\species\',Species_name]);

 %Calculation of Specific Heat by calling fn
     C_p = specific_heat(a1,a2,a3,a4,a5,b1,b2,b3,b4,b5,R,temp,global_mid);
 %Calculation of Enthalpy by calling fn
       h = Enthalpy(a1,a2,a3,a4,a5,a6,b1,b2,b3,b4,b5,b6,R,temp,global_mid);
 %Calvulation of Entropy by calling fn
       S = entropy(a1,a2,a3,a4,a5,a7,b1,b2,b3,b4,b5,b7,R,temp,global_mid);

 %Plotting the values of Specific heat,enthalpy, entropy vs Temperature
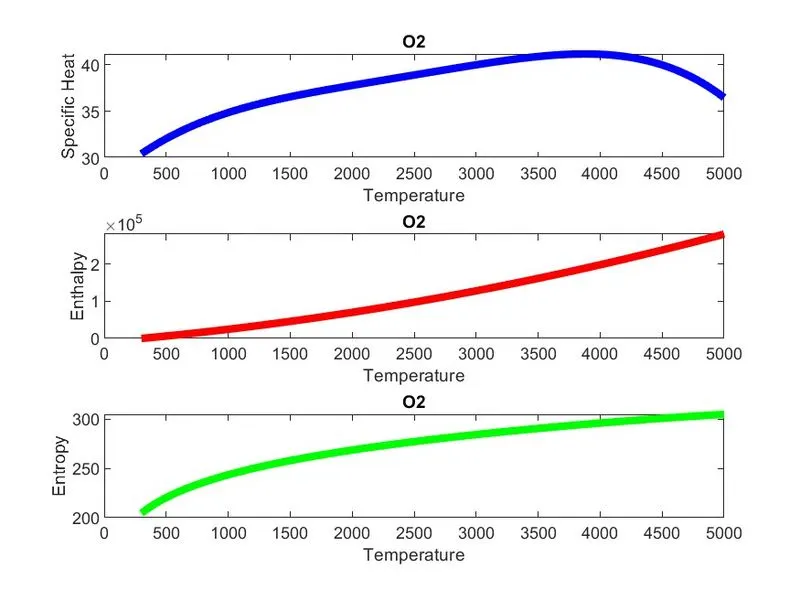
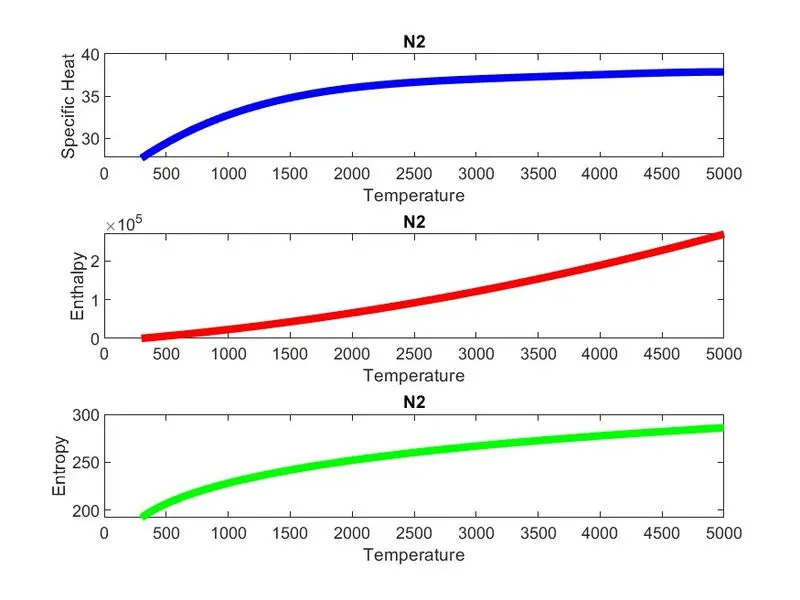
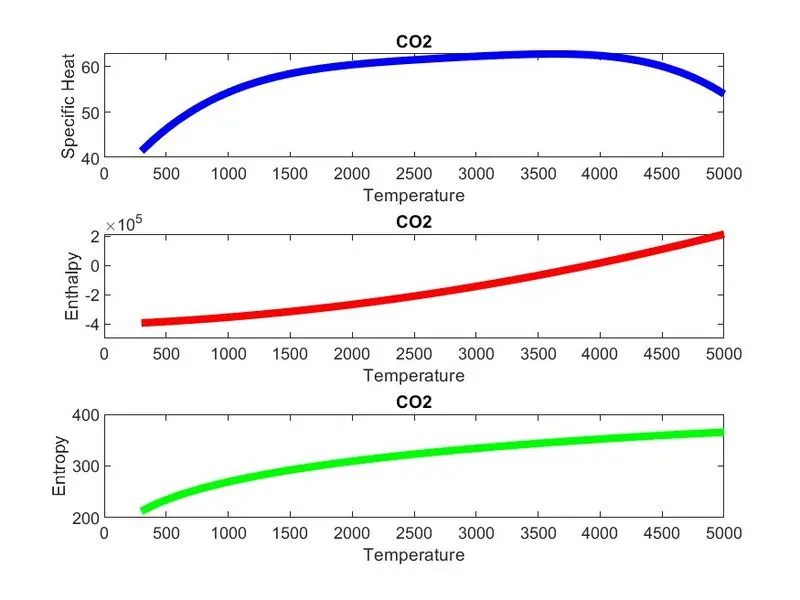
       figure(1)
       %Specific Heat vs Temperature plot
       subplot(3,1,1)
       plot(temp, C_p, 'linewidth', 4,'color', 'b');%plot based on the observed data
       title(Species_name)
       xlabel("Temperature")
       ylabel("Specific Heat")

       %Enthalpy vs Temperature plot
       subplot(3,1,2);
       plot(temp, h, 'linewidth', 4,'color', 'r');
       title(Species_name)
       xlabel("Temperature")
       ylabel("Enthalpy")

       %Entropy vs Temperature plot
       subplot(3,1,3);
       plot(temp, S, 'linewidth', 4,'color', 'g');
       title(Species_name)
       xlabel("Temperature")
       ylabel("Entropy")

%Saving the jpg file of plots for each species in individual species folder
  directory = (['C:\Users\u411715\OneDrive - Danfoss\Documents\SKILLLYNC\Parsing_New\species\',Species_name]);
  old_folder = cd(directory);    %saving old path to old_folder
  saveas(1,'output1.jpg');       %saving the plot in species folder
  %changing current directory back to the original folder
  cd(old_folder);
  %displaying values of molecular weight in the command window
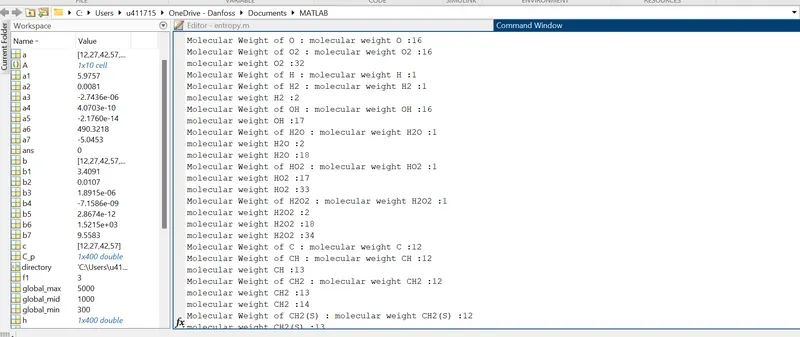
  MW = molecular_weight(Species_name);

 end
 %closing the file
 fclose(f1);
Function for specific heat calculation
%separate Function for Specific Heat Calculation
function [C_p] = specific_heat(a1,a2,a3,a4,a5,b1,b2,b3,b4,b5,R,temp,global_mid)
 if temp <= global_mid
C_p = R*(b1 + (b2*temp)+ (b3*(temp).^2)+(b4 * (temp).^3) + (b5 *(temp).^4));
else
    C_p =  R*(a1 + (a2*temp)+ (a3*(temp).^2)+(a4 * (temp).^3) + (a5 *(temp).^4));
end
Function for enthalpy calculation
% Separate function for Enthalpy calculation
function [h] = Enthalpy(a1,a2,a3,a4,a5,a6,b1,b2,b3,b4,b5,b6,R,temp, global_mid)
if temp <= global_mid
h = R.*temp.*(b1 + (b2.*(temp./2))+ (b3.*(temp./3))+(b4.*(temp./4)) + (b5.*(temp./5)) + (b6./temp));
 else
    h =  R.*temp.*(a1 + (a2.*(temp./2))+ (a3.*(temp./3))+(a4.*(temp./4)) + (a5.*(temp./5)) + (a6./temp));
end%Separate Funtion for Entropy Calculation
function [S] = entropy(a1,a2,a3,a4,a5,a7,b1,b2,b3,b4,b5,b7,R,temp, global_mid)
if temp <= global_mid
S = R.*(b1.*log(temp) + (b2.*temp)+ (b3.*(((temp).^2)./2))+ (b4.*(((temp).^3)./3)) + (b5.*(((temp).^4)./4))+ b7);
else
S = R.*(a1.*log(temp) + (a2.*temp)+ (a3.*(((temp).^2)./2))+ (a4.*(((temp).^3)./3)) + (a5.*(((temp).^4)./4))+ a7);
endFunction for Molecular weight calculation for different species-
%Separate Function for Molecular Weight Calculation
function [MW] = molecular_weight(Species_name)

element= ['H' 'C' 'N' 'O' 'Ar'];
fprintf('Molecular Weight of ');
fprintf(Species_name);
fprintf(' : ');
atomic_weight = [1 12 14 16 40];

MW = 0;

for i = 1:length(Species_name)
    for j = 1:length(atomic_weight)
        if strcmpi(Species_name(i), element(j))
            MW = MW + atomic_weight(j);

            q = j;
        end
    end

    m = str2double(Species_name(i));
    if m>1
        MW = MW + (atomic_weight(q)*(m-1));
    end
fprintf('molecular weight %s :',Species_name);
fprintf('%d',MW);
disp(' ');

end
Explanation:
1. Create the molecular weight function first, then call it in the main program to show it in the command window.
2. Read the NASA thermodynamic data with fopen(to open) and then the 'r' command.
3. Extract and save the world temperatures from the NASA file.
4. Extract the file's local temperatures.
5. Read all of the NASA data file coefficients from a1 to a7 and b1 to b7 and convert the string to a number using'str2double'.
6. Create a folder/directory called 'nasa data' in 'C:' to hold all of the graphs.
7. Using the thermodynamic relations, calculate the specific heat (Cp), enthalpy (H), entropy (S), and molecular weight by invoking the function.
8.Plot the data with the plot command and save the figure in png format with the saveas command.
9. The command window will display the molecular weight.
Output: