Week 5 - Curve fitting
Aim:- To write codes to perform curve fitting by using python.
Objective:-
- Writing the codes to fit a linear and cubic polynomial for the Cp data.
- Plotting the linear and cubic fit curve with help of cp vs temperature data file.
- Measuring the fitness characteristics for both the curves
Theory:-
Curve fitting is one of the techniques of data analysis to validate and to find the mathematical relationship between experimental data.
- Interpolation is a method where a function is used to exact to the data points.
- Smoothing is a method to finding a function that is an approximate fit to the data points.
The goodness of fit - It's a measure of fitness of curve for given data and there are four parameters to calculate the goodness of fit.
- The sum of squares due to error (SSE)
- R-Square (R^2)
- Adjusted R-Square,
- Root mean squared error (RMSE)
Input:- inputing file- Cp vs Temperature data file
Program:-
# Program for curve fitting
#Importing module
import math
import matplotlib.pyplot as plt
import numpy as np
from scipy.optimize import curve_fit

# reading the thermodynamic data file
def read_file ():
	temperature = []
	cp = []
	for line in open('data','r'):
		values = line.split(',')
		temperature.append(float(values[0]))
		cp.append(float(values[1]))

	return[temperature,cp]

# curve fit function (linear function)
def func(t,a,b):
	return a*t+b

# Main program
temperature,cp = read_file()
#print (temperature,cp)

popt,pcov = curve_fit(func,temperature,cp)
#print(popt)
#print(pcov)
fit_cp = func(np.array(temperature),*popt)

plt.figure()
plt.plot(temperature,cp,color='blue',linewidth=1)
plt.plot(temperature,fit_cp,color='red',linewidth=1)
plt.legend(['Actual data','linear curve fit'])
plt.xlabel('temperature(k)')
plt.ylabel('specific heat (Cp)')
plt.title('linear curve fitting')
plt.grid()
plt.show()


# curve fit function (cubic polynomial function)

def func(t,a,b,c,d):
	return a*pow(t,3)+b*pow(t,2)+c*t+d

popt,pcov = curve_fit(func,temperature,cp)
predicted_cp = func(np.array(temperature),*popt)
plt.figure()
plt.plot(temperature,cp,color='blue',linewidth=1)
plt.plot(temperature,predicted_cp,color='red',linewidth=1)
plt.legend(['Actual data','cubic curve fit'])
plt.xlabel('temperature(k)')
plt.ylabel('specific heat (Cp)')
plt.title('cubic curve fitting')
plt.grid()
plt.show()

# Goodness of fitting
#Measuring the fitness characterstic of the curves
"""SSE = Sum of error squared
SSR = Sum of erroe squared
SST = Sum of the squared total
RMSE = Root mean squared error
SST = SSR/SST
RMSE = (SSE/1)^0.5
"""
s = np.sum(cp)
l = np.size(cp)

# Finding mean of Cp data
m = s / l
print('Mean of all cp :', m,'\n')

# For Linear curve fit
linear_sse = 0
linear_ssr = 0
for i in range(l):
    linear_error = abs((np.sum((cp[i] - fit_cp[i]))))

    linear_sse = linear_sse + pow(linear_error, 2)
    linear_ssr = linear_ssr + np.sum(pow((fit_cp[i] - m), 2))

print('For Linear Curve Fit')
linear_sst = linear_sse + linear_ssr
print('Linear SST :', linear_sst)
linear_R2 = linear_ssr / linear_sst
print('Linear R2 :', linear_R2)
linear_rmse = pow((linear_sse / l), 0.5)
print('Linear RMSE :', linear_rmse ,'\n')

# For Cubic curve fit
cubic_sse = 0
cubic_ssr = 0
for j in range(l):
    cubic_error = abs(np.sum((cp[i] - predicted_cp[i])))
    cubic_sse = cubic_sse + (pow(cubic_error, 2))
    cubic_ssr = cubic_ssr + np.sum(pow((predicted_cp[i] - m), 2))

print('For Cubic Curve Fit')
cubic_sst = cubic_sse + cubic_ssr
print('Cubic SST :', cubic_sst)
cubic_R2 = cubic_ssr / cubic_sst
print('Cubic R2 :', cubic_R2)
cubic_rmse = pow((cubic_sse / l), 0.5)
print('Cubic RMSE :', cubic_rmse)
Output:-
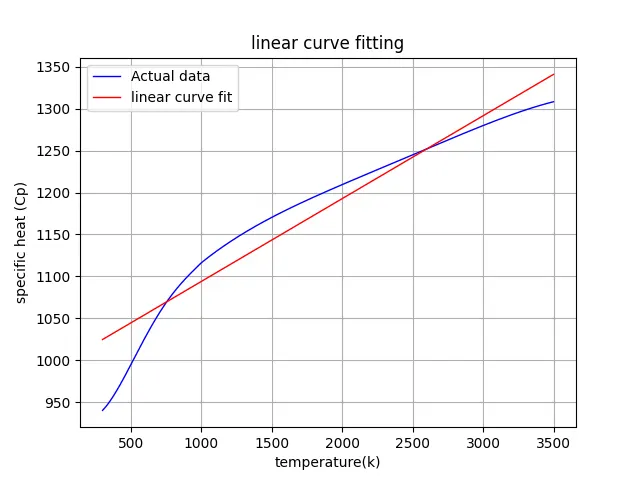
Plot of Linear function
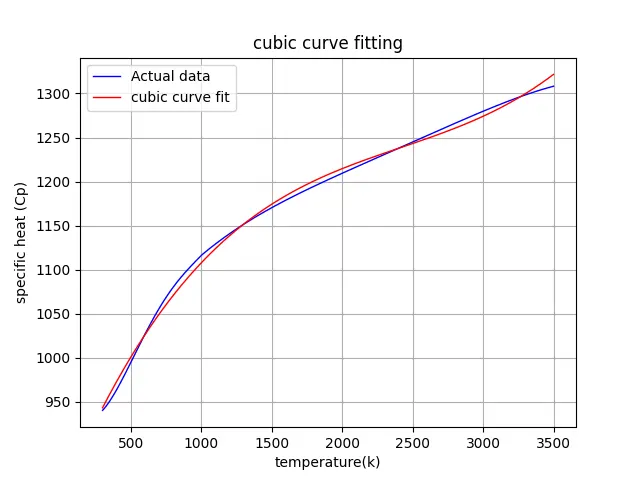
Plot of Cubic polynomial function
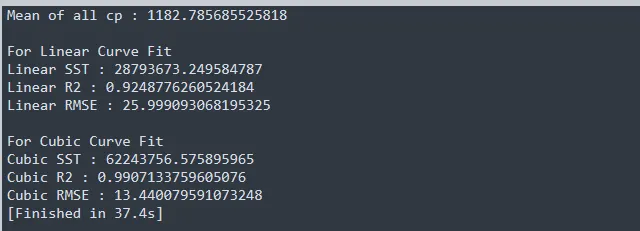
Output values
Q&A:-
1. What does popt and pcov mean?
Ans. ‘popt’ : It is an array that stores the values of the coefficients that are being passed in a given function.
‘pcov’ : It is a two-dimensional array that stores the values of the estimated co-variance of ‘popt’ i.e the coefficients.
2. What does np.array(temperature) do?
Ans. This is a command which is used to converts each value of temperature in the data file into an array using the NumPy module.
3. What does the * in *popt mean?
Ans. '*' in ‘*popt' indicates and returns each coefficient stored in popt array.
4 .What needs to be done in order to make the curve fit perfect?
Ans . By increasing the order of the polynomial the value of will be close to 1 and is assumed to a perfect fit and also splitting the data set into different groups of certain range or both.
Conclusion:- In linear function, curve fitting is bad and In Cubic function, curve fitting is good. Curve fitting program run successfully and result found satisfactory.