Week 5 - Curve fitting
curve fitting for temperature module
Quadratic Function Graph
The quadratic function is a second order polynomial function:
f(x) = ax2 + bx + c
The solutions to the quadratic equation are the roots of the quadratic function, that are the intersection points of the quadratic function graph with the x-axis, when
f(x) = 0
When there are 2 intersection points of the graph with the x-axis, there are 2 solutions to the quadratic equation.
When there is 1 intersection point of the graph with the x-axis, there is 1 solution to the quadratic equation.
When there are no intersection points of the graph with the x-axis, we get not real solutions (or 2 complex solutions).
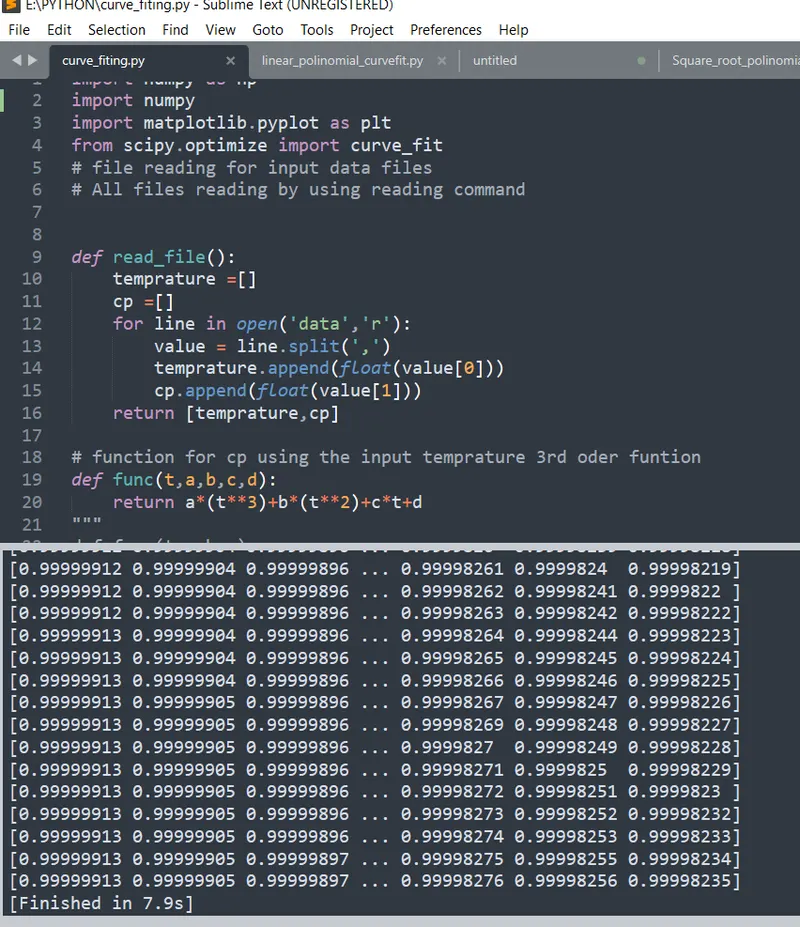
import numpy as np
import numpy
import matplotlib.pyplot as plt
from scipy.optimize import curve_fit
# file reading for input data files
# All files reading by using reading command
def read_file():
temprature =[]
cp =[]
for line in open('data','r'):
value = line.split(',')
temprature.append(float(value[0]))
cp.append(float(value[1]))
return [temprature,cp]
# function for cp using the input temprature 1st oder funtion
def func(t,a,b):
return a*t+b
# function cp for second 2 oder function
"""
def func(t,a,b,c):
return a*(t**2)+b*t+c
"""
# function cp for 3oder function
"""
def func(t,a,b,c,d):
return a*(t**3)+b*(t**2)+c*t+d
"""
# function call given data analysing
temprature,cp = read_file()
popt, pcov = curve_fit(func,temprature,cp)
fit_cp=func(np.array(temprature),*popt)# ALL temperature array(np.array(temperature)) has to substitue and all optimum value to subtituted(*popt)
plt.plot(temprature,cp,color="red",linewidth=3)
plt.plot(temprature,fit_cp,color="blue",linewidth=3)
plt.legend(['Actual data', 'curve fit'])
plt.xlabel('temperature[K]')
plt.ylabel('cp')
plt.show()
#linear curve fit Anlysis process
length =len(temprature)
for i in range (length):
error= cp-fit_cp
sse=pow(error,2)
rmse_val=sse/6
rmse=pow(rmse_val,0.5)
mean=numpy.array(cp[i])-numpy.array(i)
ssr=pow(numpy.array(cp[i])-numpy.array(mean),2)
sst=ssr+sse
r_square=ssr/sst
print(r_square)
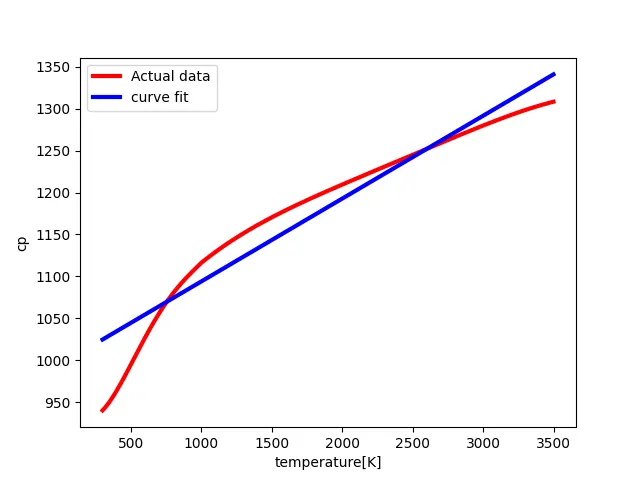
conclution
error value are going 0.99989665-0.99989629
that value are almost going to Zero that value fit good
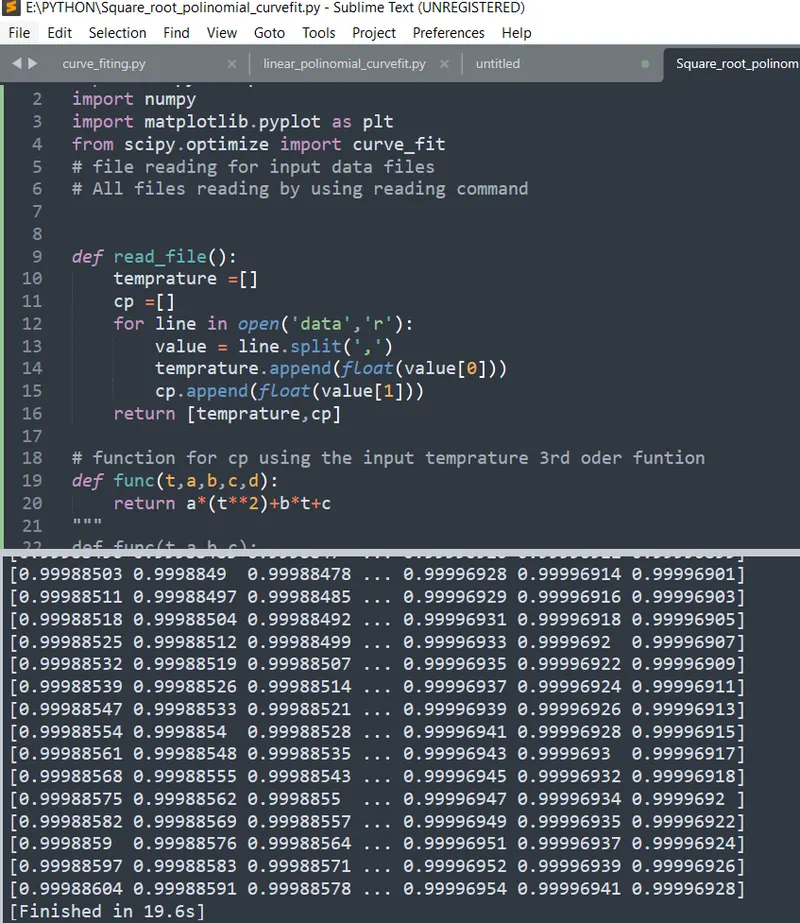
Second order equation curve fit
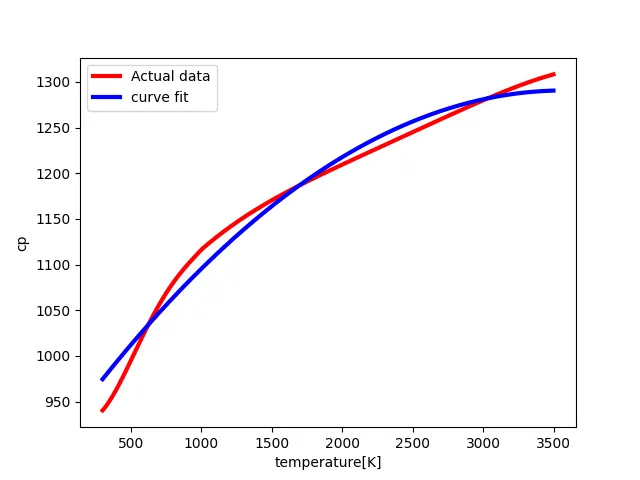
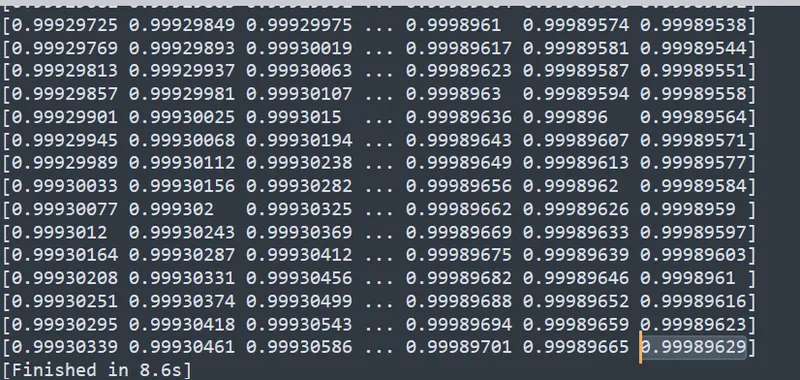
2 nd order error 0.99996928-0.99996941
difference value almost going to zero so the fit good(perfect)
3rd order equation curve fit
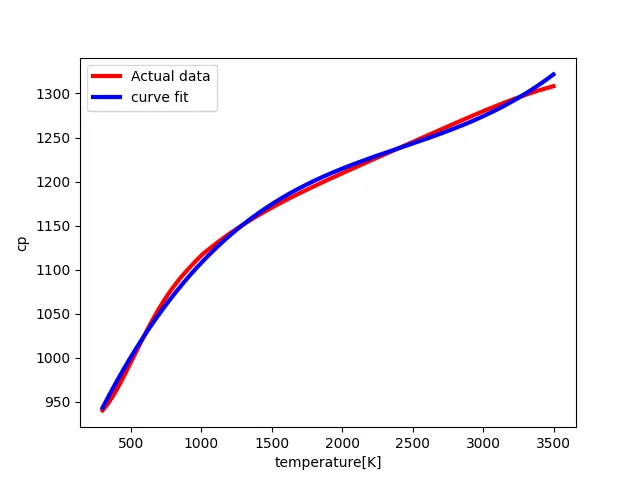
3rd oder error 0.99998235-0.99998256
differnce value alomost to zero good fit