Week 5 - Curve fitting
Curve Fitting
What is Curve Fitting?
Curve fitting is the process of constructing a curve, or mathematical functions, which possess the closest proximity to the real series of data. By curve fitting, we can mathematically construct the functional relationship between the observed dataset and parameter values, etc. It is highly effective in the mathematical modeling of some natural processes.
Question 1.
What do popt and pcov mean? (Watch the video to get some context)
Answer:-
- Popt-It is an array. These will be our coefficients in the program. It represents the unknowns
in the function defined in the program so later, it will be the output as its curves fit function
calculates it. Or in other words, optimal values for the parameters so that the sum of the
squared error is minimized. - pcov-The estimated covariance of popt. The diagonals provide the variance of the
parameter estimate.
Question 2.
What does np.array(temperature) do?
Answer:-
- np. array(temperature) stores the values of temperature in the form of an array and passes
it to numpy function.
Question 3.
What does the * in *popt mean?
Answer:-
- It stores the values of unknown variables in popt array.
Question 4.
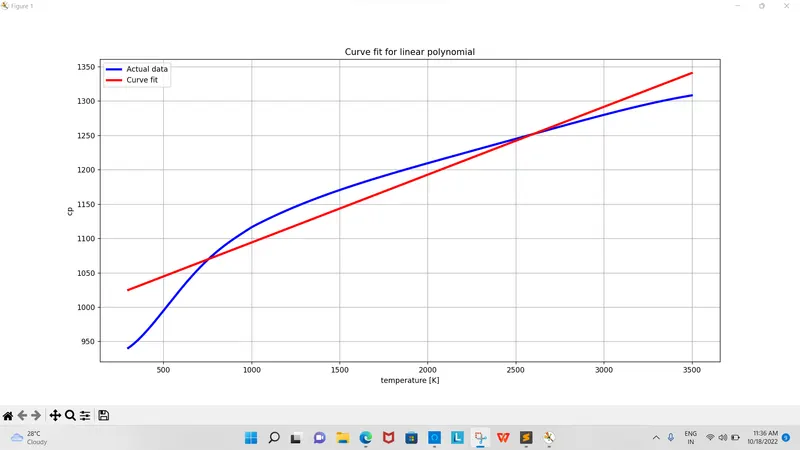
Write code to fit a linear and cubic polynomial for the Cp data. Explain if your results
are good or bad
# Python program to fit linear polynomial
import numpy as np
import matplotlib.pyplot as plt
from scipy.optimize import curve_fit

# curve fit function

def linear(t ,a ,b):
	return a*t + b

# Reading Thermodynamic data file
def read_file():
	temperature = []
	cp = []
	for line in open('data','r'):
		values = line.split(',')
		temperature.append(float(values[0]))
		cp.append(float(values[1]))

	return [temperature, cp ]

# Main program
temperature, cp = read_file()
popt_1, pcov_1 = curve_fit(linear, temperature, cp)
fit_cp_1 = linear(np.array(temperature), *popt_1)

plt.plot(temperature, cp,color = "blue", linewidth = 3)
plt.plot(temperature, fit_cp_1,color ="red", linewidth = 3 )
plt.legend(['Actual data','Curve fit'])
plt.xlabel('temperature [K]')
plt.ylabel('cp')
plt.title("Curve fit for linear polynomial")
plt.grid()
plt.show()


# Python program to fit cubic polynomial
import numpy as np
import matplotlib.pyplot as plt
from scipy.optimize import curve_fit

# curve fit function

def cubic(t ,a ,b, c, d):
	return a*pow(t,3) + b*pow(t,2) + c*t + d

# Reading Thermodynamic data file
def read_file():
	temperature = []
	cp = []
	for line in open('data','r'):
		values = line.split(',')
		temperature.append(float(values[0]))
		cp.append(float(values[1]))

	return [temperature, cp ]

# Main program
temperature, cp = read_file()
popt_1, pcov_1 = curve_fit(cubic, temperature, cp)
fit_cp_1 = cubic(np.array(temperature), *popt_1)

plt.plot(temperature, cp,color = "blue", linewidth = 3)
plt.plot(temperature, fit_cp_1,color ="red", linewidth = 3 )
plt.legend(['Actual data','Curve fit'])
plt.xlabel('temperature [K]')
plt.ylabel('cp')
plt.title("Curve fit for cubic polynomial")
plt.grid()
plt.show()
RESULTS:
FOR POLYNOMIAL CUBE
FOR FIT AND QUADRIC CUBE
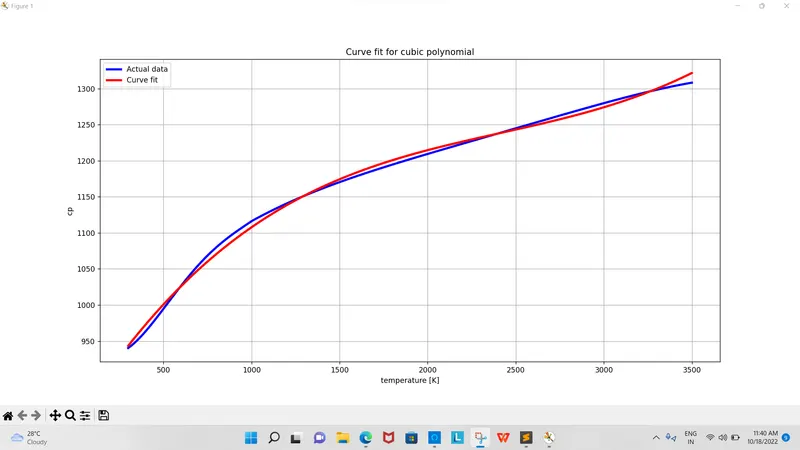
5]. What needs to be done in order to make the curve fit perfectly?
The curve can be made to fit perfectly in the following ways
a] By increasing the order of the polynomial.
b] By using cross-validation techniques where data is fit into n folds. The stepwise fold is used to validate the model then choose a lower error.
c] By increasing the center and scaling the curve.
1] For obtaining the best fit of the curve it should have the least sum of squares of numbers various methods are there to reduce the error
In the case of the R square method, if R^2 is greater than 0.95, the curve is said to be the best fit that is R^2>0.95 for best fit.
2] The cubic fit can be improved in the following ways
a] By using the split-wise method to solve the curve
b] By increasing the order of the Polynomial or normalizing the given polynomial.