Week 5 - Curve fitting
TASK: CURVE FITTING IN PYTHON:
1. What does popt and pcov mean?
popt - An array of optimal values for the parameters which minimizes the sum of squares of residuals.
pov - 2d array which contains the estimated covariance of popt. The diagonals provide the variance of the parameter estimate.The returned parameter covariance matrix pcov is based on scaling sigma by a constant factor. This constant is set by demanding that the reduced chisq for the optimal parameters popt when using the scaled sigma equals unity. In other words, sigma is scaled to match the sample variance of the residuals after the fit.
2. What does np.array(temperature) do?
It Converts the python list of temperature to a numpy array since operations like pow are allowed on numpy arrays and not python lists.
A numpy array of temperature is a grid of values, all of the same type, and is indexed by a tuple of nonnegative integers. The number of dimensions is the rank of the array; the shape of an array is a tuple of integers giving the size of the array along each dimension.
3. What does the * in *popt mean?
Optimal values for the parameters so that the sum of the squared residuals of f(xdata, *popt) - ydata is minimized.
*- reference to popt – the values are stored in the array popt.
A asterisk(*) symbol is helps us to refers the coefficients value for which respective equations.
4. Write code to fit a linear and cubic polynomial for the Cp data.
EXPLANATION :
1) Importing the neccessary modules such as numpy, matplotlib, curve fit from scipy optimize and mean from statistics.
2) Matplotlib modules is help us to plotting, numpy module is help to operting the arrays, mean module is help us to average the list and curve fit module is help us to finding the polynomial coefficients and finding the covariance of that polynomial.
3) Defining the functions for both linear equation and cubic equation and also create a function to extracting the temperature & Specific heat value from data file.
4) By using curve fit function to calculate the coefficients of polynomial & Covariance respective to type of polynomial euation. If we want to calculate those of the thing by using temperature, specific heat and respective function either linear or cubic.
5) After that, we calculated the predicted specific heat values in each and every temperatures for both linear and cubic equation.
6) We want to check the fit by uisng some goodness fit criteria like SSE, R Square, Rsquare Adjustable and RSME for both linear and cubic fit.
7) Print it down the order of goodness of fit criteria values and make a plot in separately.
Program Code:
import math
import matplotlib.pyplot as plt
import numpy as np
from scipy.optimize import curve_fit

# curve Fitting
def func(t,a,b,c):
	return a*t+b
def func_cubic(t,a,b,c,d):
	return a*pow(t,3)+b*pow(t,2)+c*t+d

def read_file():
	temperature = []
	cp = []
	for line in open('data','r'):
		values = line.split(',')
		temperature.append(float(values[0]))
		cp.append(float(values[1]))
	return [temperature,cp]

# Main Program
temperature,cp = read_file()
popt,pcov = curve_fit(func,temperature,cp)
fit_cp = func(np.array(temperature), *popt)

popt1,pcov1 = curve_fit(func_cubic,temperature,cp)
fit_cp_cubic = func_cubic(np.array(temperature), *popt1)


# Resultant Plots

plt.plot(temperature,cp,color="blue",linewidth =3)
plt.plot(temperature,fit_cp,color="red",linewidth =3)
plt.xlabel('Temperature in [K]')
plt.ylabel('Specific Heat cp')
plt.legend(['actual data','linear curve fit'])
plt.title('actual data vs linear curve fit')
plt.savefig('linear fit')
plt.show()

plt.plot(temperature,cp,color="blue",linewidth =3)
plt.plot(temperature,fit_cp_cubic,color="red",linewidth =3)
plt.xlabel('Temperature in [K]')
plt.ylabel('Specific Heat cp')
plt.legend(['actual data','cubic curve fit'])
plt.title('actual data vs cubic curve fit')
plt.savefig('Cubic fit')
plt.show()
Output Plots:
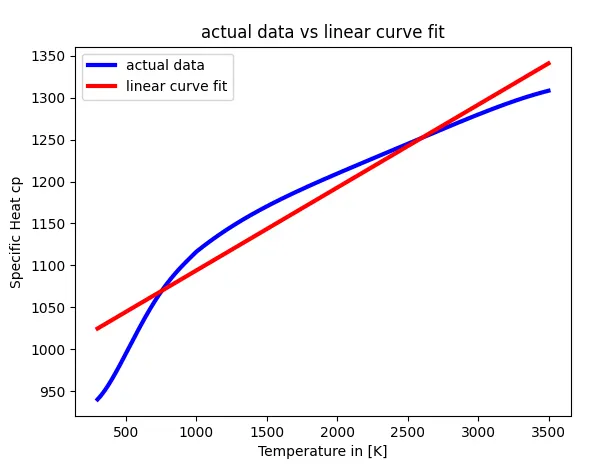
Linear Fit Plot:
Cubic Fit plot:
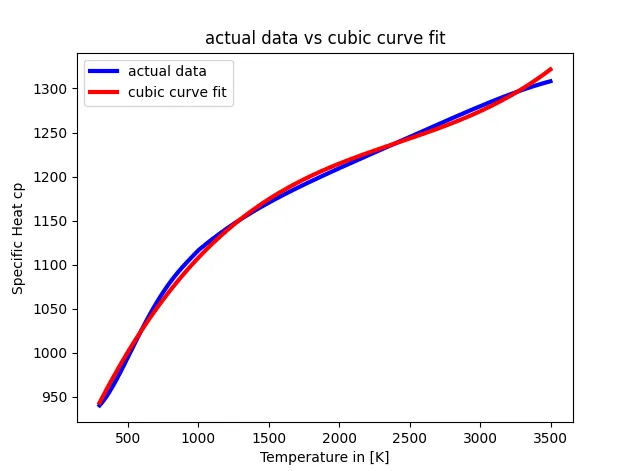
Our results when compared from linear to cubic polynomials, it is very much fitter and seems good.
5. What needs to be done in order to make the curve fit perfect?
Increase the order of polynomial to when the predicted curve will perfectly match to actual curve or else split the orginal data points at different ranges, write a python code in proper manner to get achieve the curve fit without increasing the polynomial of equation.
6. Show empirically as to how well your curve has been fit?
By observation, a cubic predicted curve has been almost fit into original data curve with some tolerance compared to linear predicted curve. If curve fit overlapped to original data with comes under the defined some tolerances, it is called best fit.
The perfect fit is always a best fit, but the best fit is not a perfect fit.
Even By increasing the polynomial we will more exact fit to the actual data fit.
CONCLUSION :
A predicted cubic curve is almost overlapped with original data curve compared to linear predicted curve. So, Cubic curve is best curve fit.