Week 5 Battery characteristics using drive cycle
Question:
Simulate generic battery model charge discharge using UDDS data.
Answers:
Circuit:
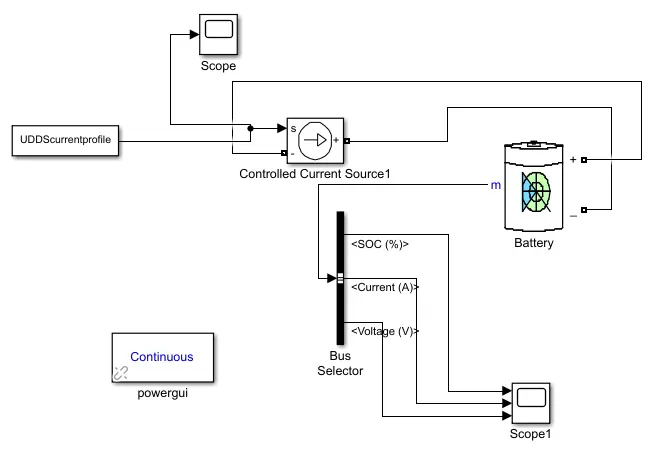
Connections:
It consists of the input value which is been get to the circuit from the workspace of the matlab with the help of the From workspace block.
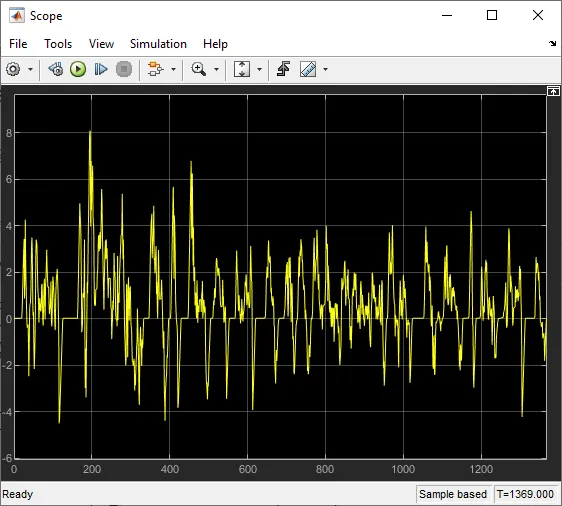
The scope is been connected to the input and the value is been given below.
The signal is been connected to the controlled voltage source which is been connected in series to it in their s inout.
The negative is been connected to the input of the battery and its negative is connected to the positive of the controlled current source which is connected in series to it.
The m of the battery is been connected to the bus selector.
Buscollector is been connected to the scope with the three connections, the SOC ,current and the voltage.
The powergui is been connected in the model because without it the circuit wont be having enough power to simulate.
Input:
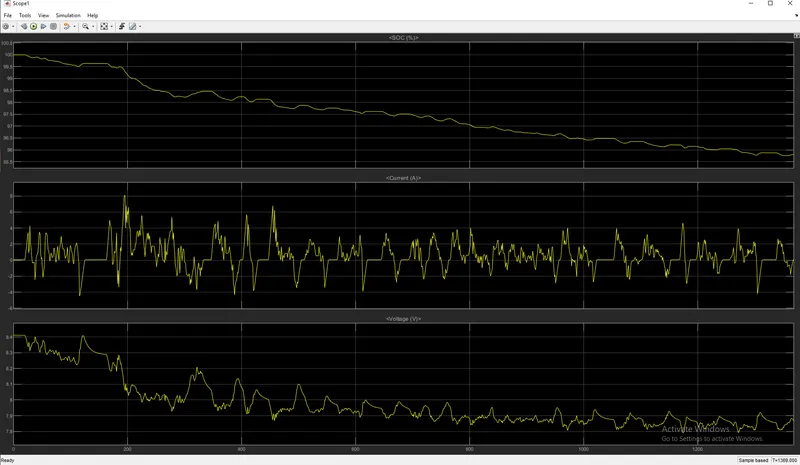
Output:
Explanation:
Here the first graph explains SOC of the battery in Percentage, it clearly tells that SOC is travelling downwards integrating the draining of the battery.We have state that the battery charge comes down to 96% from 100%.SOC curve moves towards up indicating the charging mode. and the second curve states the voltage relationship with the time in seconds and thrid curve states the current vs time plot, whcich is totally based on the drive cycle data imported and the negative current indicating the charging state of the battery and the positive charge states the discharging state of the battery.
UDDS cycle:https://docs.google.com/spreadsheets/d/1jRLbK1GaNOzQbS-DKyr9G7skm97IK830/edit#gid=73183158